
The price of Bitcoin (BTC) has been trading between $29,900 and $31,160 for the past 18 days, causing concern among investors who are looking for explanations for the lack of a clear trend.
After a 25.5% rally between June 15 and June 23 leading to Bitcoin’s highest level in 13 months one would expect investors to become more active and optimistic, but the lack of BTC’s ability to sustain prices above $31,000 and neutral on-chain and derivatives data do not corroborate this thesis.
Bitcoin ETF expectations faced a harsh regulatory environment
The current price situation is particularly worrisome because of the expectations that arose after BlackRock, the world’s largest fund manager, applied for a spot Bitcoin ETF on June 16. Some analysts have predicted a Bitcoin price of $100,000 by the end of the year, adding to the frustration of traders who are betting on further gains.
It’s worth noting that in mid-April, investors experienced a consolidation of prices around $30,000, but it didn’t last longer than a week, and the price eventually dropped to $28,000. This movement explains why investors are hesitant to build positions at the current price levels and prefer range trading.
Despite the initial excitement about the possibility of the U.S. Securities and Exchange Commission (SEC) approving a Bitcoin instrument for traditional finance markets, there’s negative price pressure due to the regulatory actions against leading exchanges like Coinbase and Binance.
This combination of positive triggers and a stricter regulatory environment is likely the main cause of Bitcoin’s recent price movement, and analyzing blockchain data could provide insights into the network’s use.
Bitcoin on-chain activity does not show a significant improvement in activity
When it comes to blockchain-based analysis, network activity should be the starting point. This analysis should entail looking beyond just trading and exchange flows. Cryptocurrencies were designed to facilitate free transactions and the registration of digital assets, so the number of active users is crucial.
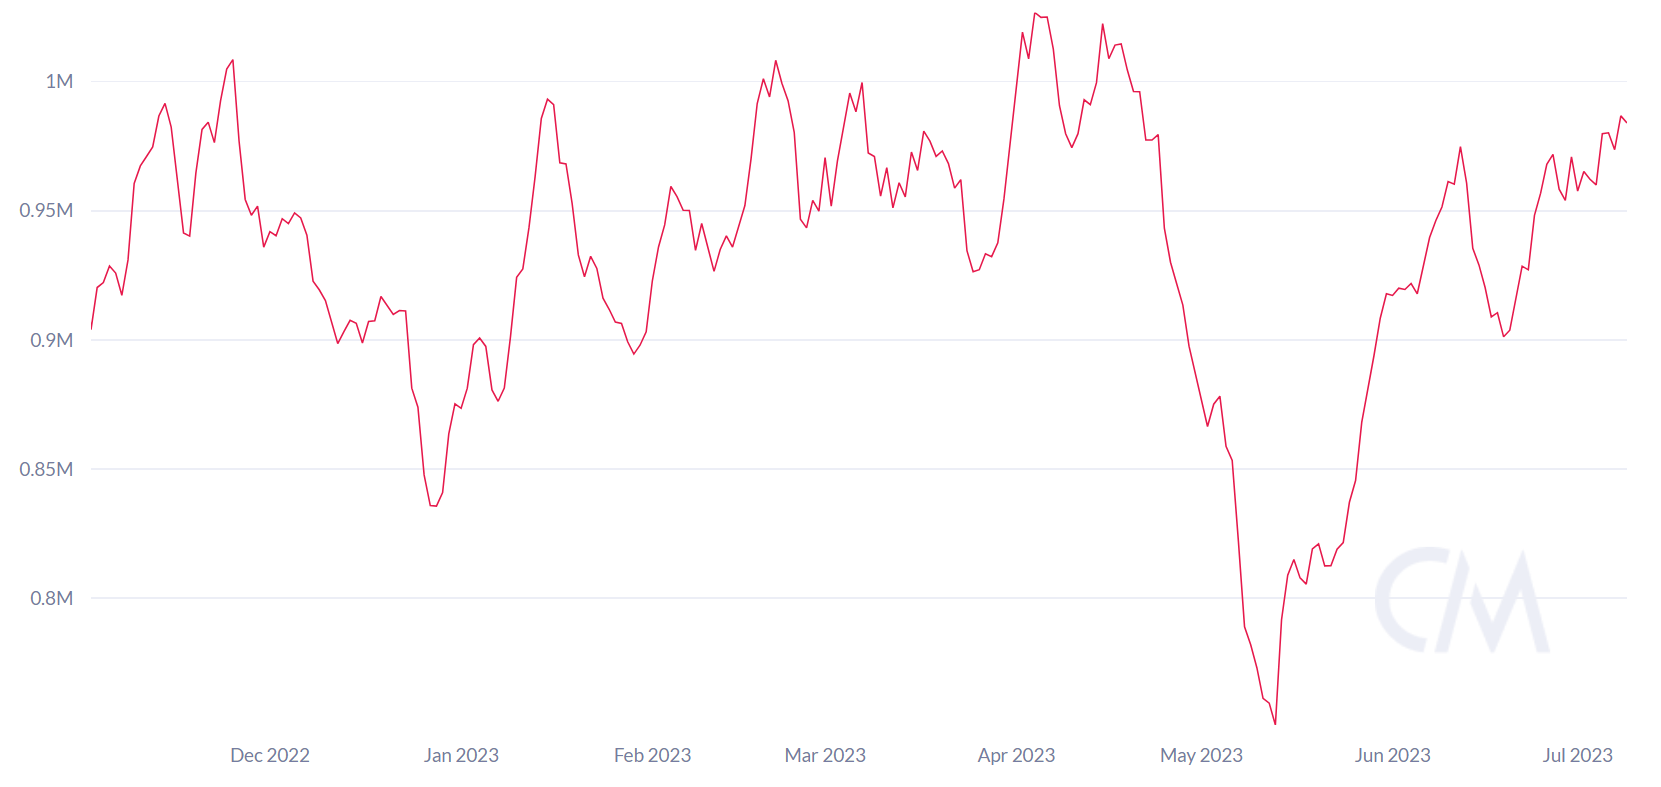
Bitcoin’s 7-day active addresses have failed to exceed 1 million, only reaching the same levels as three months ago. Moreover, the peak of 1.02 million addresses in April 2023 was 16% lower than the all-time high in January 2021. Therefore, on-chain data indicates a stagnation in the number of active users on the Bitcoin network, using addresses as a proxy.
One might argue that reclaiming the level of active addresses back in April 2023 is good enough, but to evaluate the demand from institutional investors one should analyze the network’s address count with a minimum of 100 Bitcoin, which is worth over $3 million at current price levels.
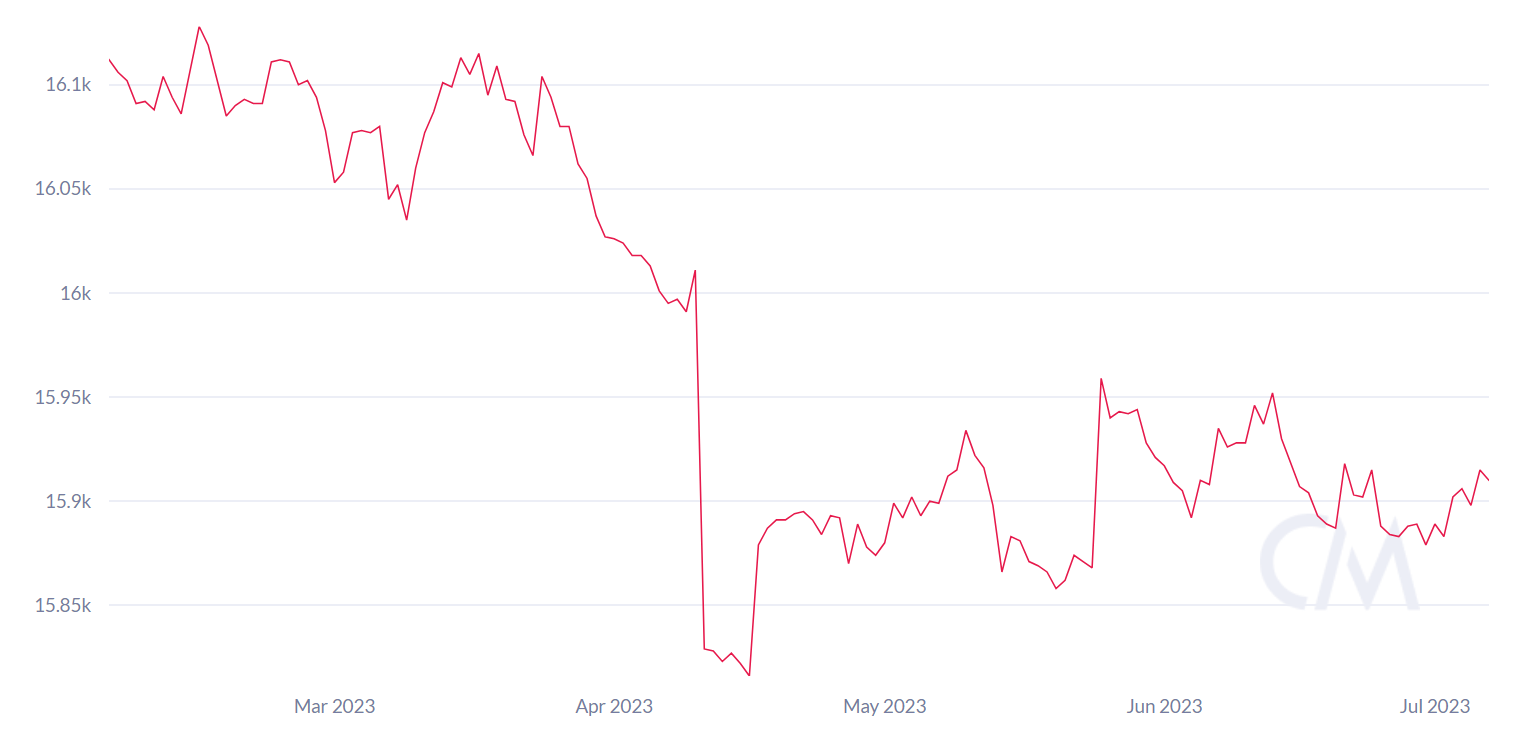
Upon closer examination, it becomes evident that the indicator has remained unchanged for the past few months in 15,900 addresses. This suggests that there hasn’t been an increase in the number of whales accumulating Bitcoin during that period.
Considering this, along with the fact that active addresses haven’t reached new highs, on-chain metrics suggest that the ETF launch hasn’t yet triggered a bullish momentum.
Bitcoin derivatives improve but are majority neutral
To confirm whether the price reflects stagnant network activity, one should analyze Bitcoin derivatives metrics and measure the demand for leverage from professional traders. In neutral markets, Bitcoin quarterly futures contracts typically trade at a 5 to 10% annualized premium, known as contango, which is not unique to crypto markets.
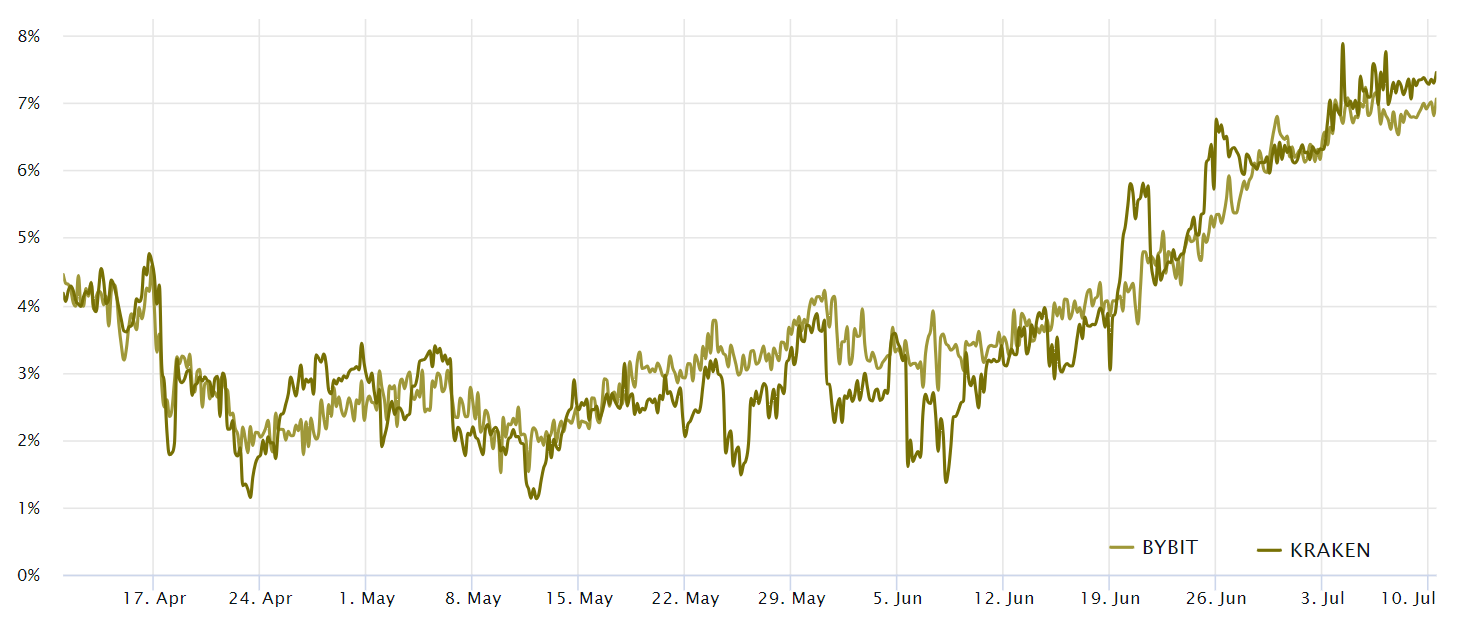
The Bitcoin futures premium crossed the neutral 5% threshold on June 26, just five days after the $30,000 support level was breached. It took investors a full 18 months to turn bullish using leveraged long positions, reaching the highest price point since June 2022. This significantly increases the likelihood of liquidations and panic selling if the Bitcoin price drops by 8% in a short period.
Looking at the options markets is also helpful, as the 25% delta skew is a telling sign of when arbitrage desks and market makers overcharge for upside or downside protection. In essence, if traders anticipate a Bitcoin price drop, the skew metric will rise above 7%, and phases of excitement tend to have a negative 7% skew.
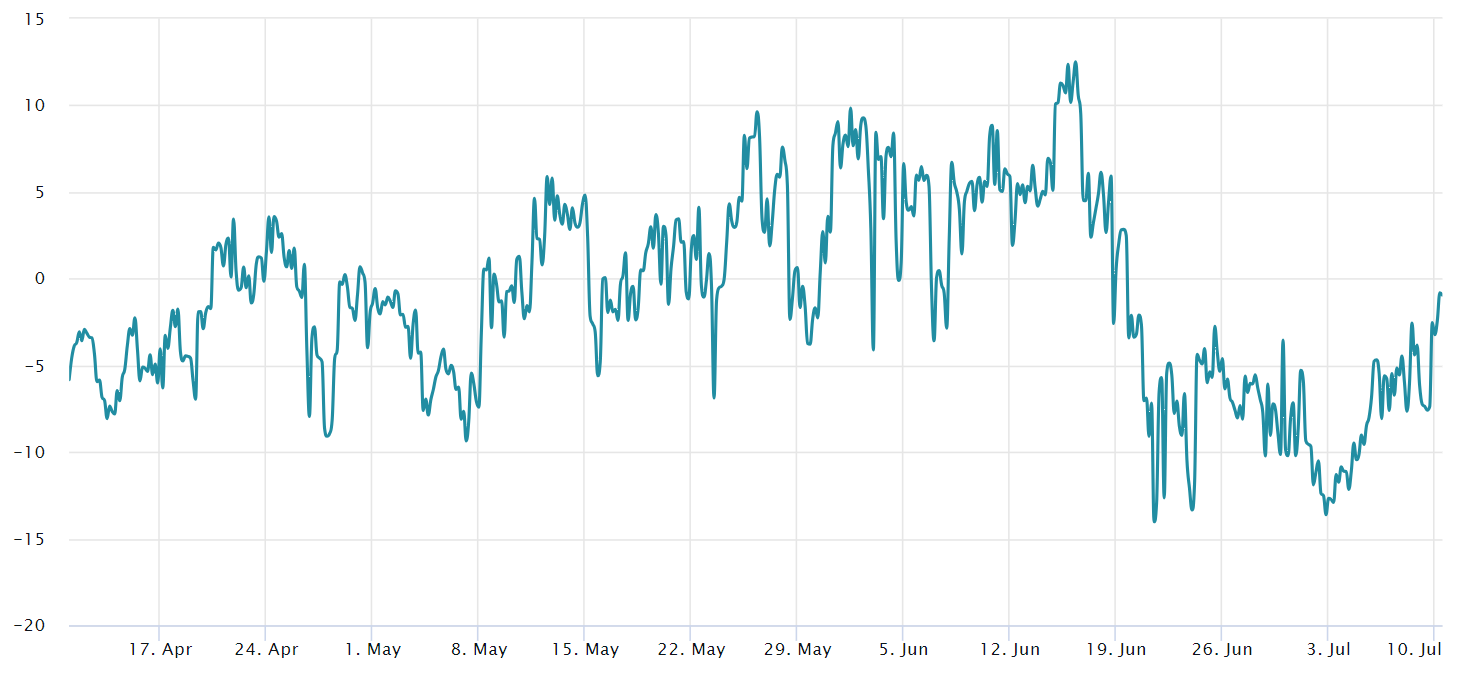
However, the 25% delta skew failed to sustain levels below the neutral threshold for more than four days. The only period of moderate bullishness, according to the options pricing indicator, was from July 1 to July 5. The current balanced demand between call and protective put options indicates a lack of confidence from professional traders.
These findings are particularly disappointing considering that senior Bloomberg analysts estimated a 50% chance of Bitcoin ETF approval. After the recent price rally above $30,000, one would expect on-chain and derivatives data to reflect more optimism, which might be influenced by Bitcoin’s price being 56% below its all-time high, or the impending court rulings against the exchanges.
Ultimately, at the moment, on-chain and derivatives data fail to support the bullish momentum to sustain further price gains.
This article is for general information purposes and is not intended to be and should not be taken as legal or investment advice. The views, thoughts, and opinions expressed here are the author’s alone and do not necessarily reflect or represent the views and opinions of Cointelegraph.
