
Bitcoin (BTC) has been stuck in a narrow range for the past several days. A minor positive is that the range has formed near the recent local high. This suggests that the bulls are not rushing to the exit as they anticipate another leg higher.
Bitcoin’s consolidation has pulled its market dominance to 48% from over 50% on June 30. This shows that market participants have been gradually shifting their focus to select altcoins, which are starting to move up.
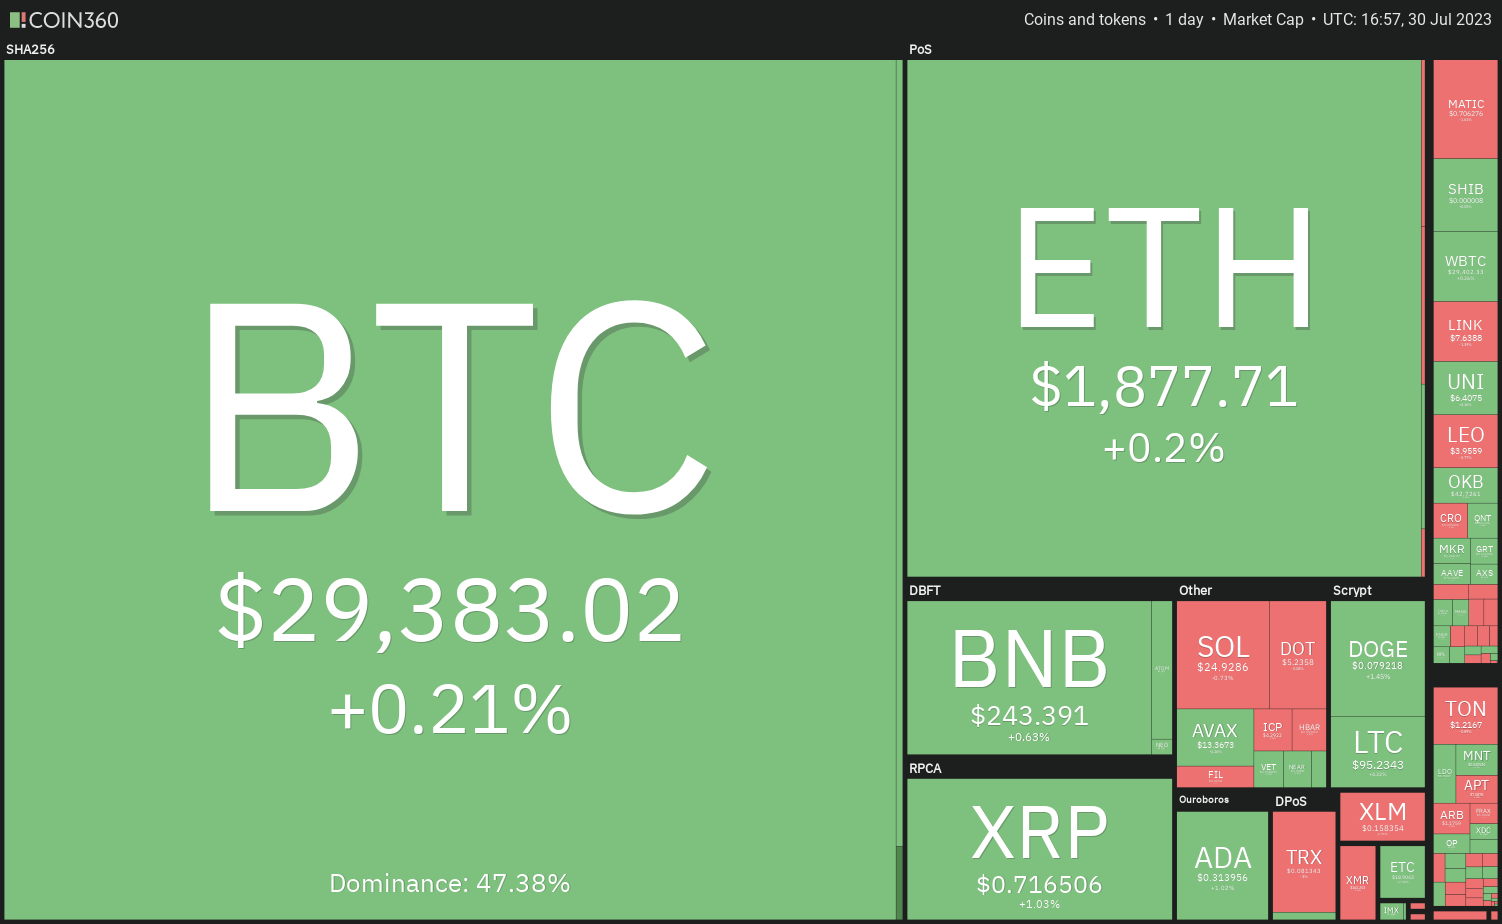
However, an altcoin recovery is likely to remain in place only till Bitcoin shows strength. If Bitcoin turns down sharply, the possibility of a sell-off in altcoins remains high. While select altcoins provide trading opportunities, cryptocurrency traders should be careful and keep a close watch on Bitcoin’s price action.
What are the important support and resistance levels to watch out for on Bitcoin? Let’s study the charts of top-5 cryptocurrencies that may try to move in the near term.
Bitcoin price analysis
The bulls managed to sustain Bitcoin above the 50-day simple moving average ($29,377) for the past few days but a negative sign is that they haven’t been able to propel the price above the 20-day exponential moving average ($29,670).
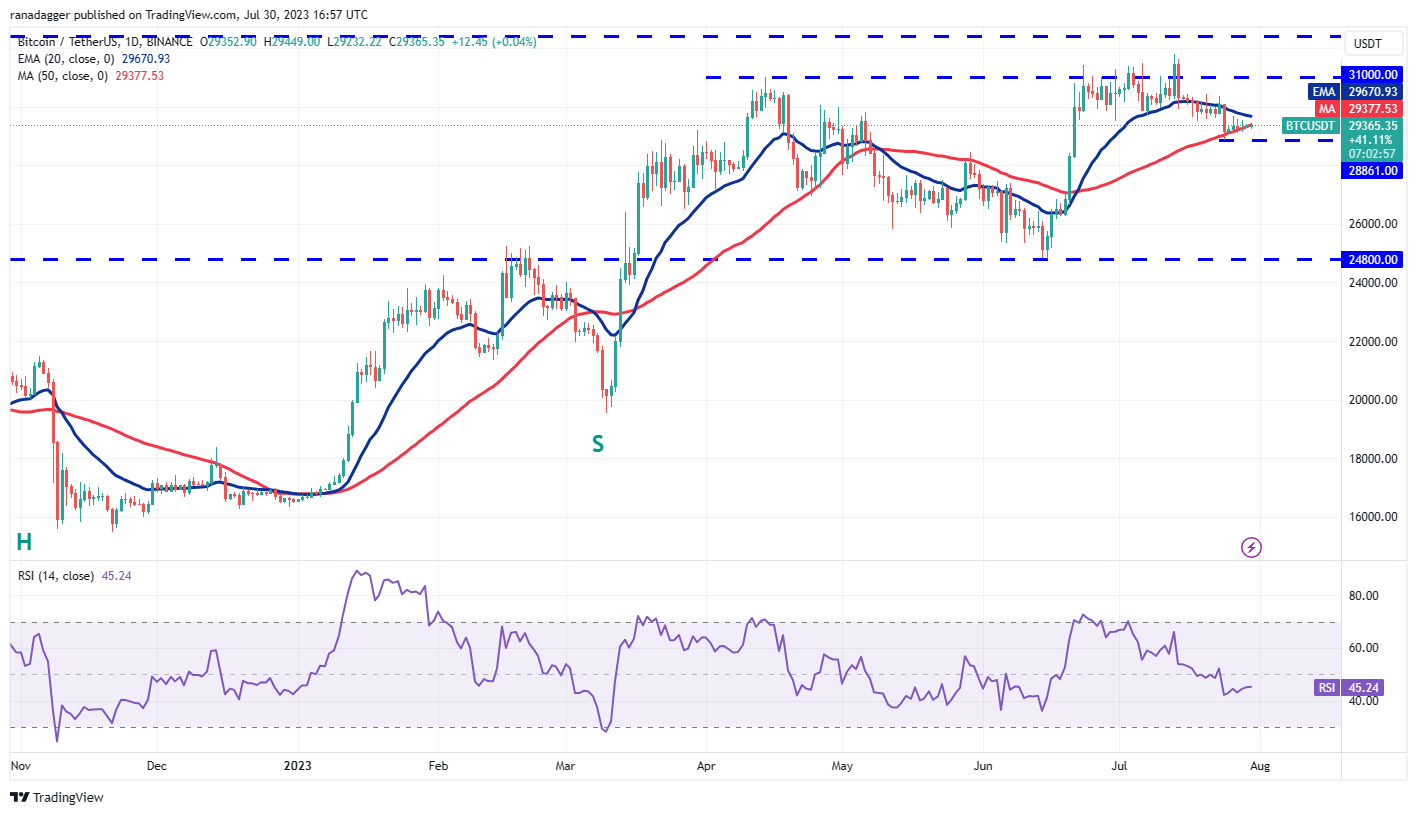
The bears will try to strengthen their position by pulling the price below the immediate support at $28,861. If they manage to do that, it will suggest that the BTC/USDT pair could stay range-bound between $31,000 and $24,800 for some time. The gradually downsloping 20-day EMA and the relative strength index (RSI) in the negative territory indicate advantage to bears.
This bearish view will invalidate if the bulls drive the price above the 20-day EMA. The pair could then rise to the overhead resistance zone between $31,000 and $32,400. The bulls will have to overcome this barrier to signal the start of a new uptrend to $40,000.
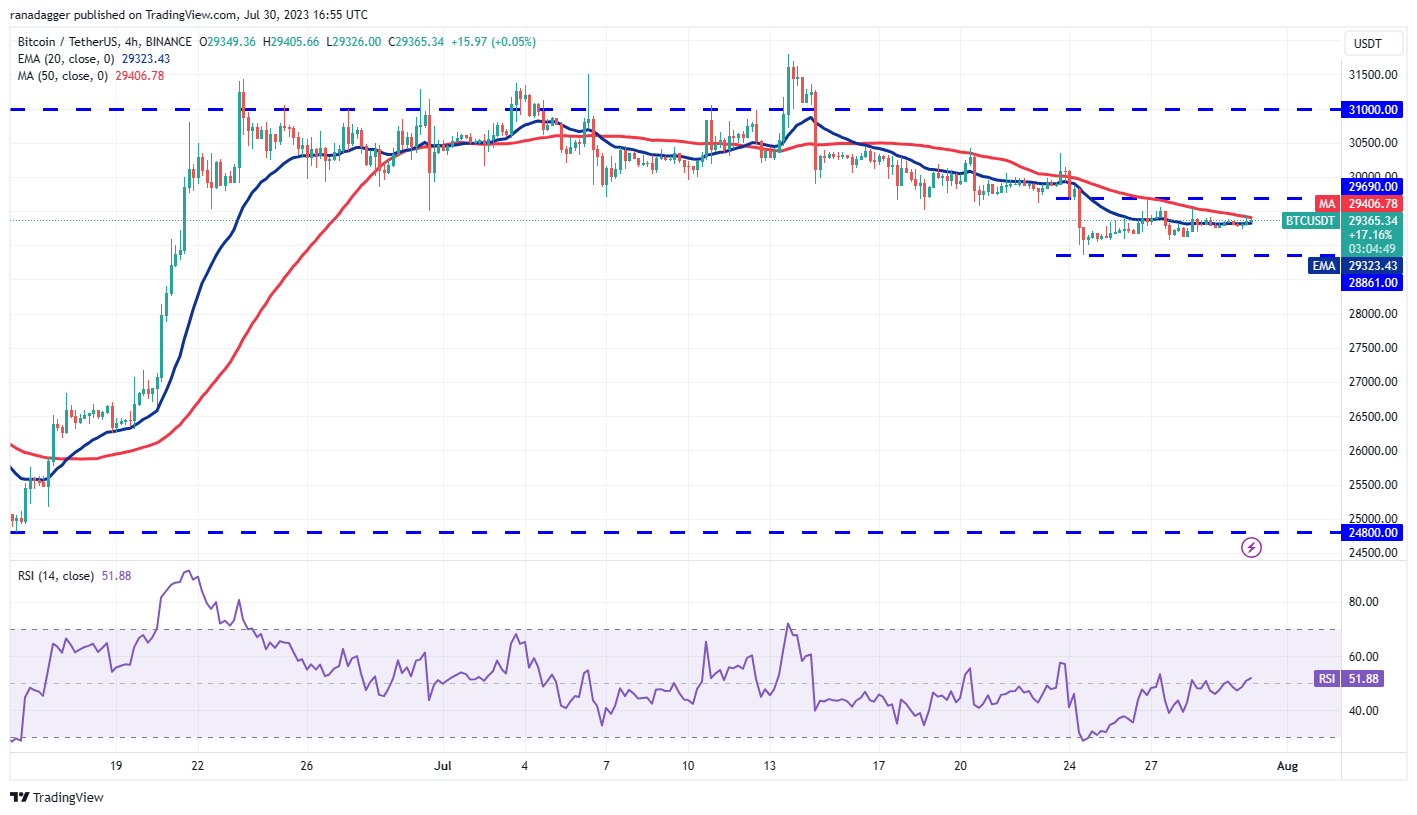
The 20-EMA has flattened out and the RSI is near the midpoint, indicating a balance between supply and demand. The pair is stuck inside a narrow range between $28,861 and $29,690.
A break and close above the overhead resistance will indicate that the advantage has tilted in favor of the bulls. The pair could then rise to $30,500 and later to $31,500.
Alternatively, if the price turns down and breaks below $28,861, it will suggest that bears are in control. The pair could then slump to $27,500.
Dogecoin price analysis
Dogecoin (DOGE) is facing resistance just above the $0.08 level but a positive sign is that the bulls have not given up much ground.
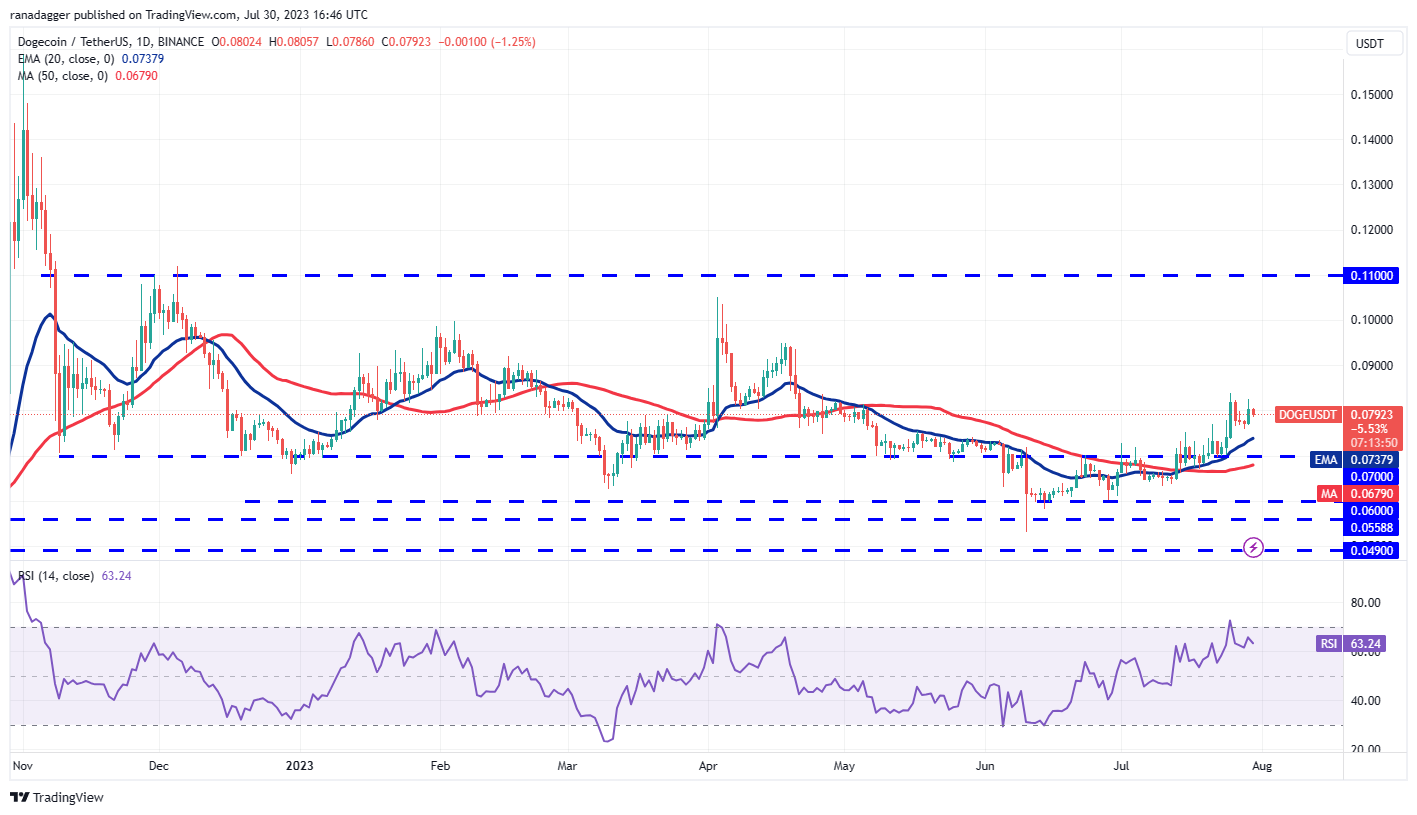
The bulls purchased the dip on July 28, indicating that the sentiment remains positive and traders are buying the dips. If bulls propel the price above the intraday high made on July 25, the DOGE/USDT pair could pick up momentum. The pair could then soar to $0.10 and subsequently to $0.11.
Contrarily, if the price turns down from the current level and plummets below the 20-day EMA, it will suggest that bears are selling on rallies. The pair could then slide to the breakout level of $0.07.
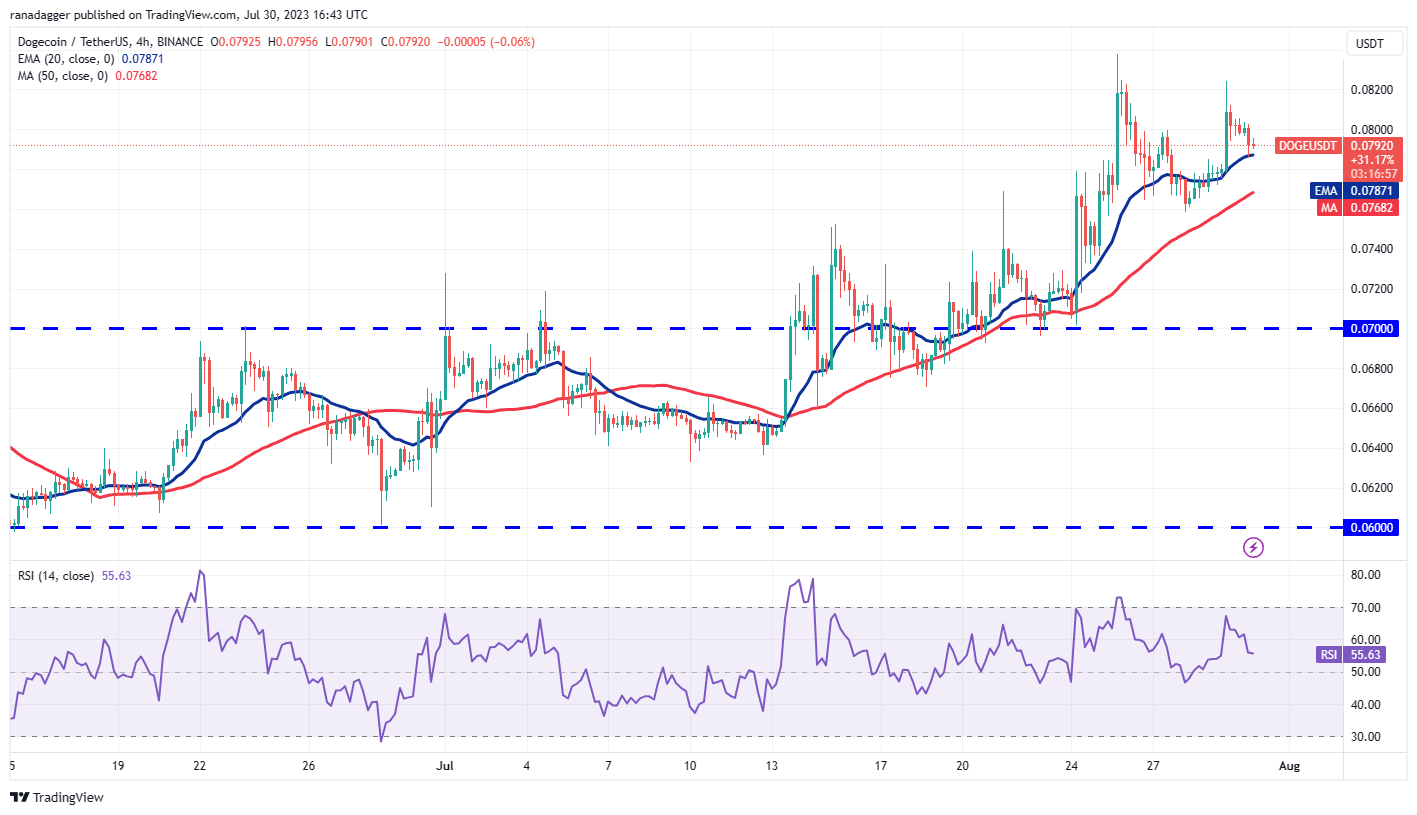
The 4-hour chart shows that the pair is in an uptrend. The price dipped below the 20-EMA but the bulls bought the dip and again pushed the price above $0.08. If bulls clear the overhead hurdle, the pair may resume its up-move.
The important support to watch on the downside is the 20-EMA and then the 50-SMA. Sellers will have to sink the price below the 50-SMA to gain the upper hand. The pair could then slump to the breakout level at $0.07.
Maker price analysis
Maker (MKR) had been stuck below $1,200 for the past several months. The bulls finally cleared this overhead obstacle on July 29.
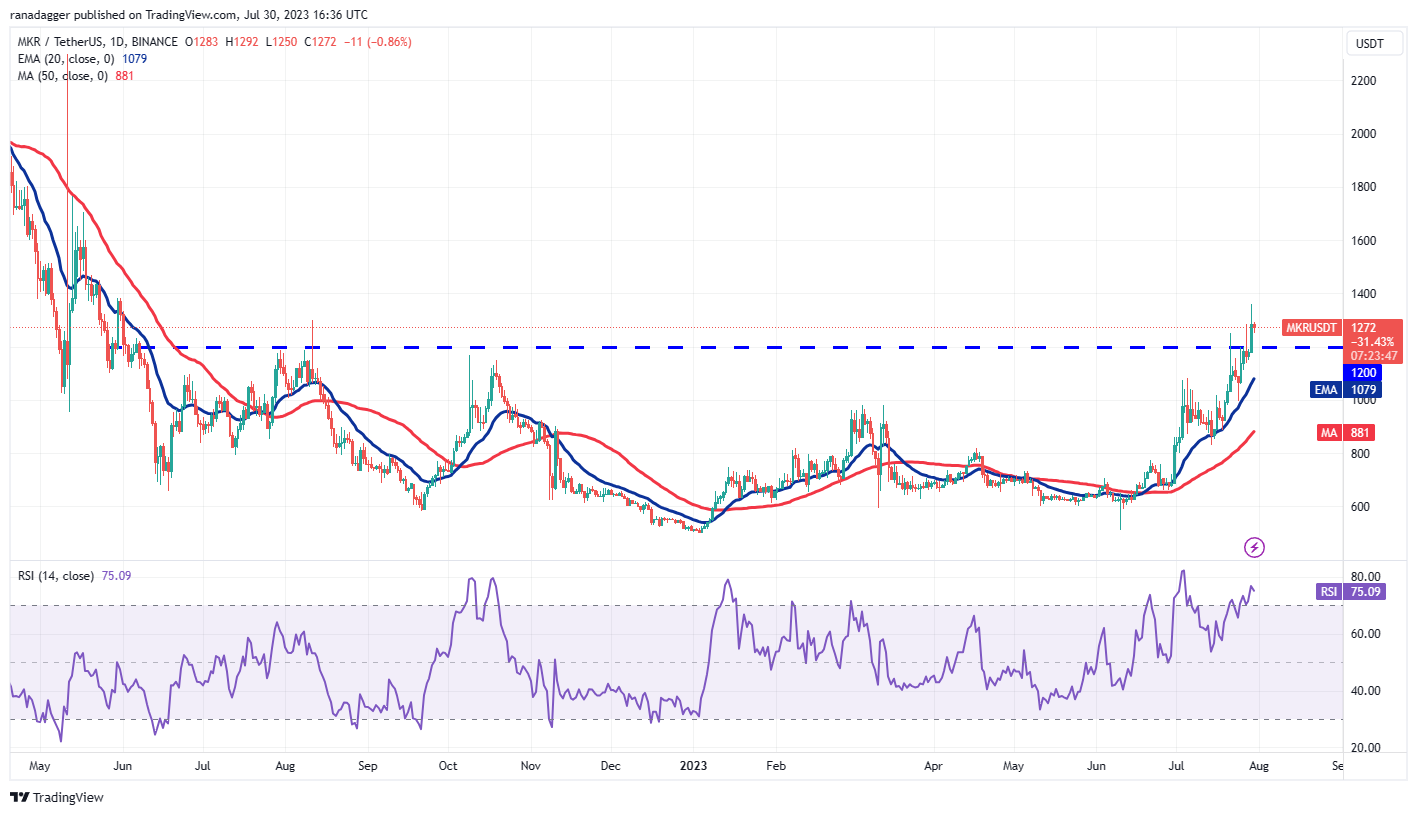
Usually, after the price breaks above a stiff overhead resistance, the price turns down and retests the breakout level. In this case, the price may drop to the breakout level of $1,200. If the price turns up sharply from this level, it will suggest that the bulls have flipped $1,200 into support. The MKR/USDT pair may then start a new uptrend toward $1,600 and then $1,900.
Conversely, if bears sink and sustain the price below $1,200, it will suggest that the recent breakout may have been a bull trap. The pair could then skid to the 20-day EMA ($1,079). A break and close below this level will suggest that the bears are back in the game.
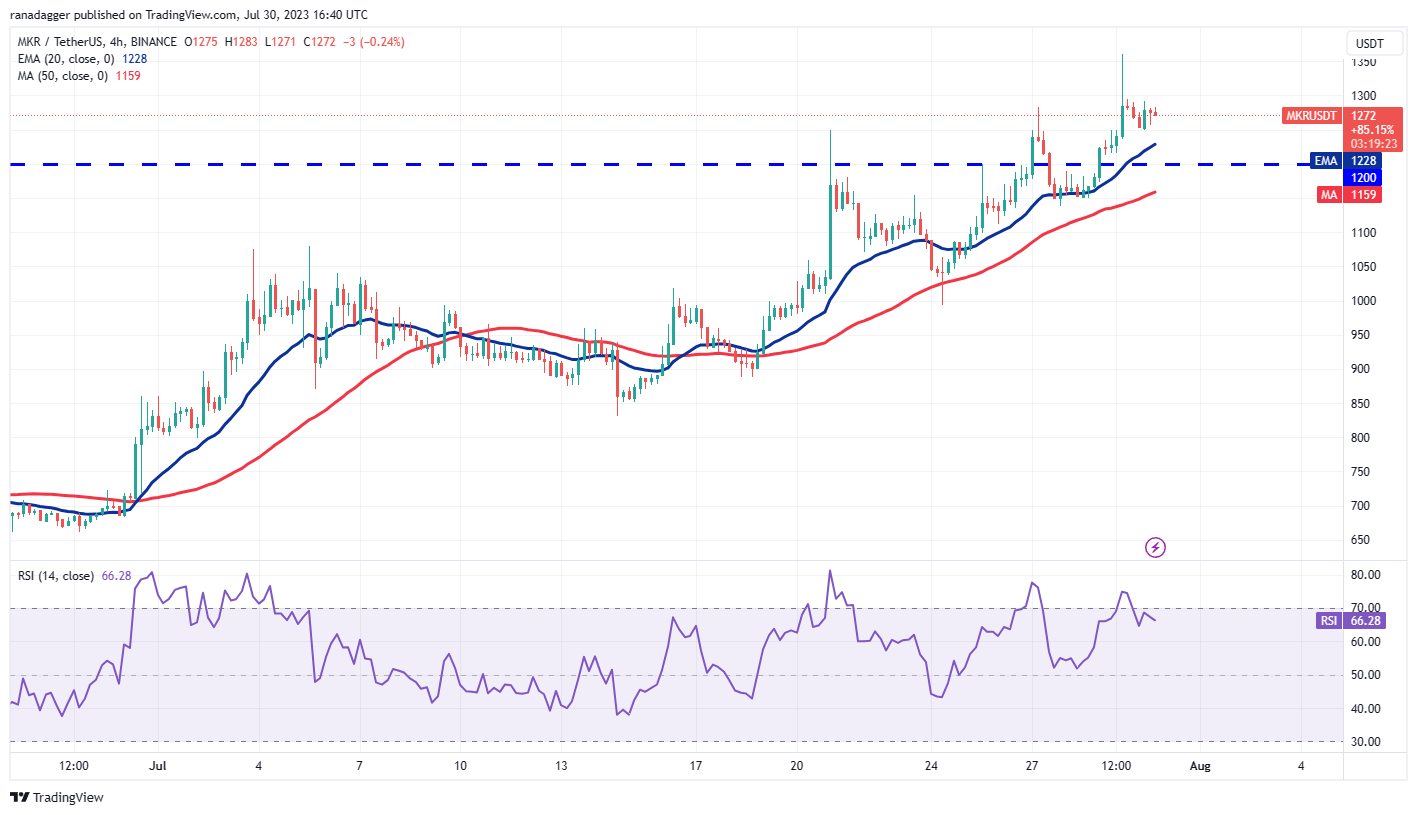
The upsloping moving averages and the RSI above 66 on the 4-hour chart indicate that the pair is in an uptrend. The price turned down from $1,361 but the bulls are likely to buy the dip to the 20-EMA.
If they do that, the pair will again try to rise above the overhead resistance of $1,361. If that happens, the pair may soar to $1,600. On the contrary, a decline below the moving averages will indicate that bears have seized control. The pair may then dump to $1,000.
Related: Bitcoin due key MACD bull flag repeat as BTC price freezes at $29.3K
Optimism price analysis
After staying in a downtrend for several days, Optimism (OP) is showing first signs of starting a new uptrend.
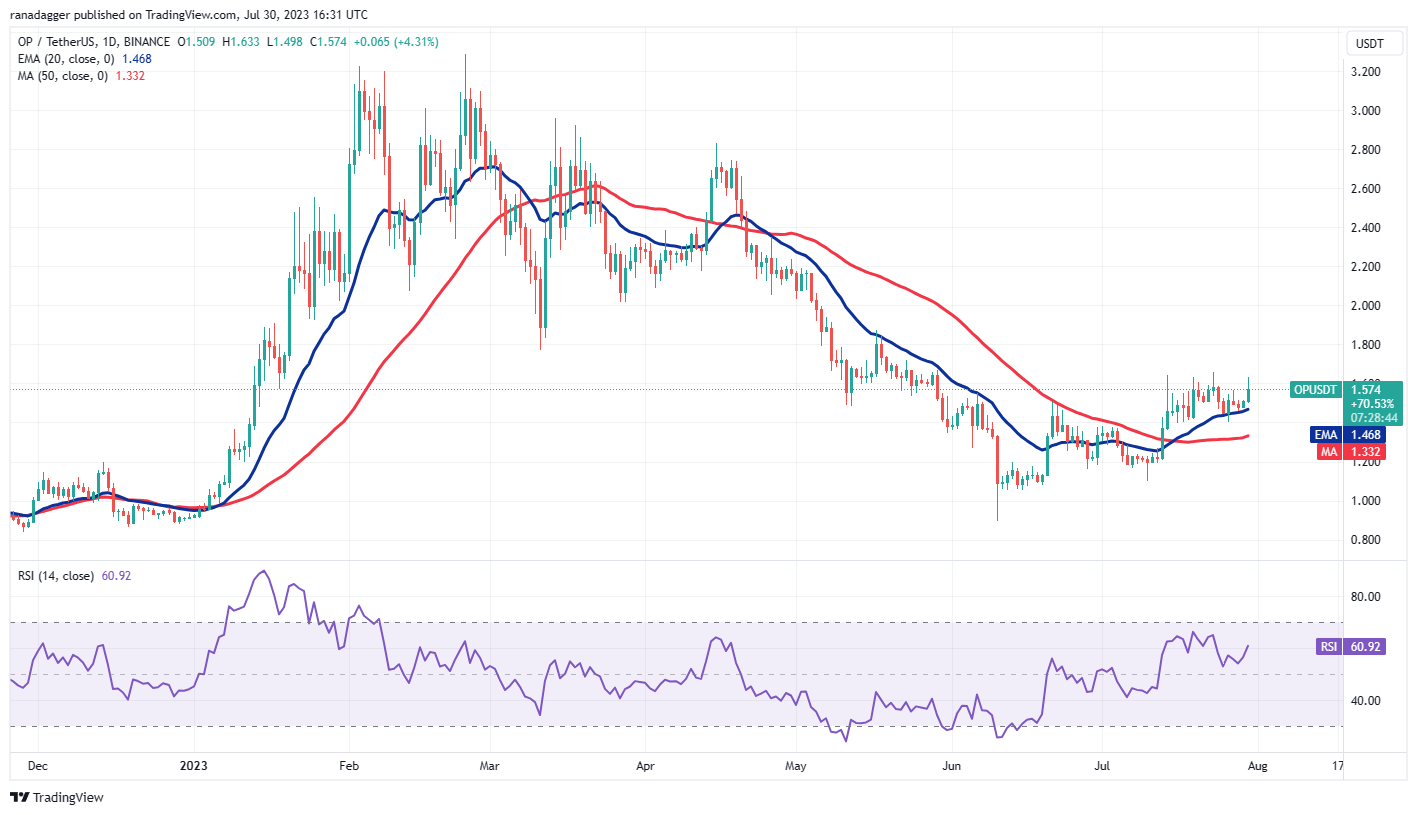
The 20-day EMA ($1.46) has started to turn up and the RSI is in the positive territory, indicating that the bulls have the upper hand. There is a minor resistance at $1.66 but if this level is crossed, the OP/USDT pair could rise to $1.88 and then to $2.
Contrary to this assumption if the price turns down from $1.66, it will suggest that bears are selling on rallies. The pair could then drop to the 20-day EMA, which is an important level to keep an eye on. If this support cracks, the pair may descend to the 50-day SMA ($1.33).
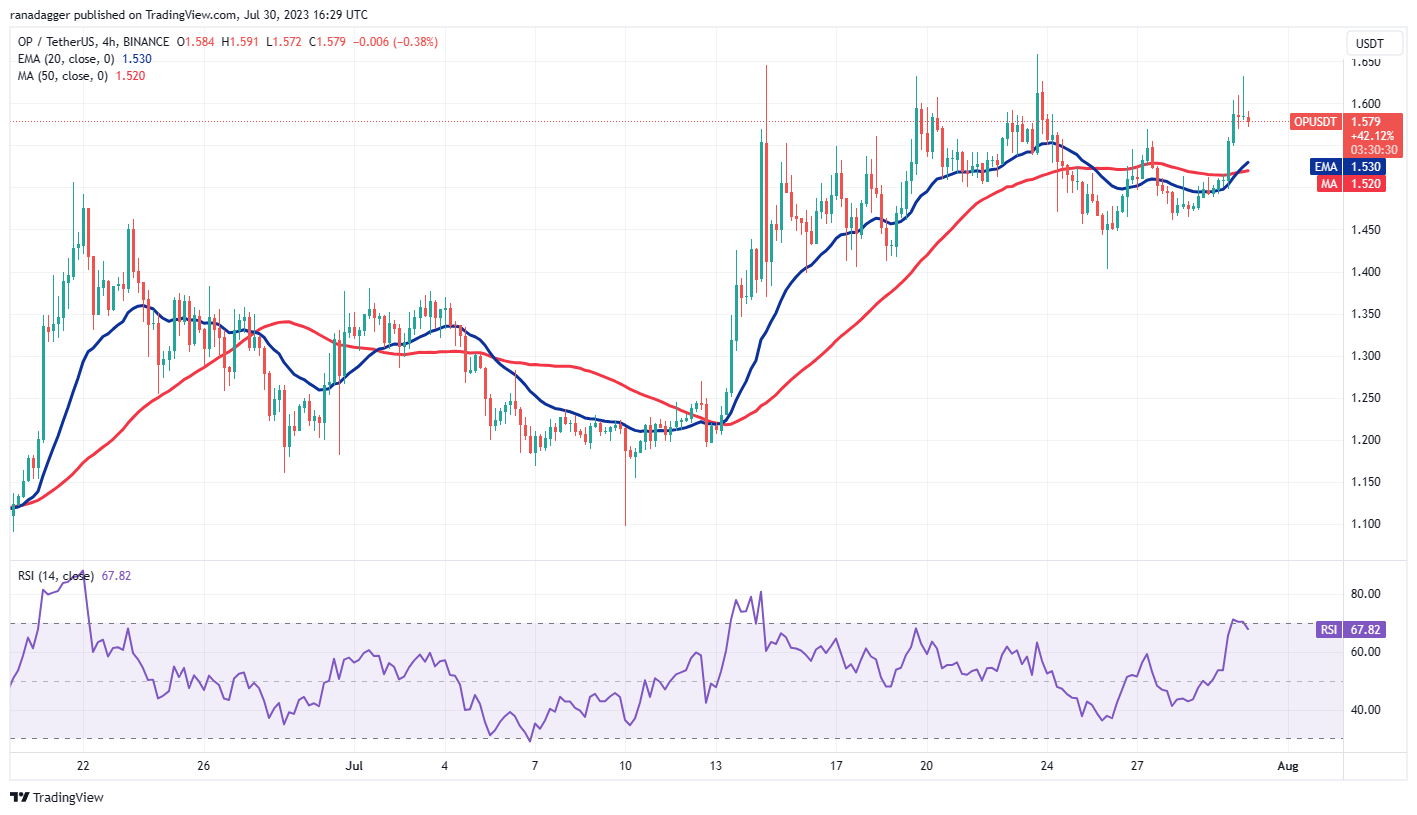
The 4-hour chart shows that the price is stuck between $1.66 and $1.40 for some time. The 20-EMA has started to turn up and the RSI is just below the overbought region, indicating that the bulls have a slight edge.
If bulls thrust the price above $1.66, the pair could resume the up-move. The first target objective on the upside is $1.92.
If the price turns down from $1.66, it will signal that the pair may extend its range-bound action for some more time. The bears will have to sink and sustain the price below $1.40 to come out on top. That could clear the path for a potential fall to $1.15.
XDC Network price analysis
The XDC Network (XDC) surged from $0.03 on July 11 to $0.06 on July 25, indicating a strong uptrend.
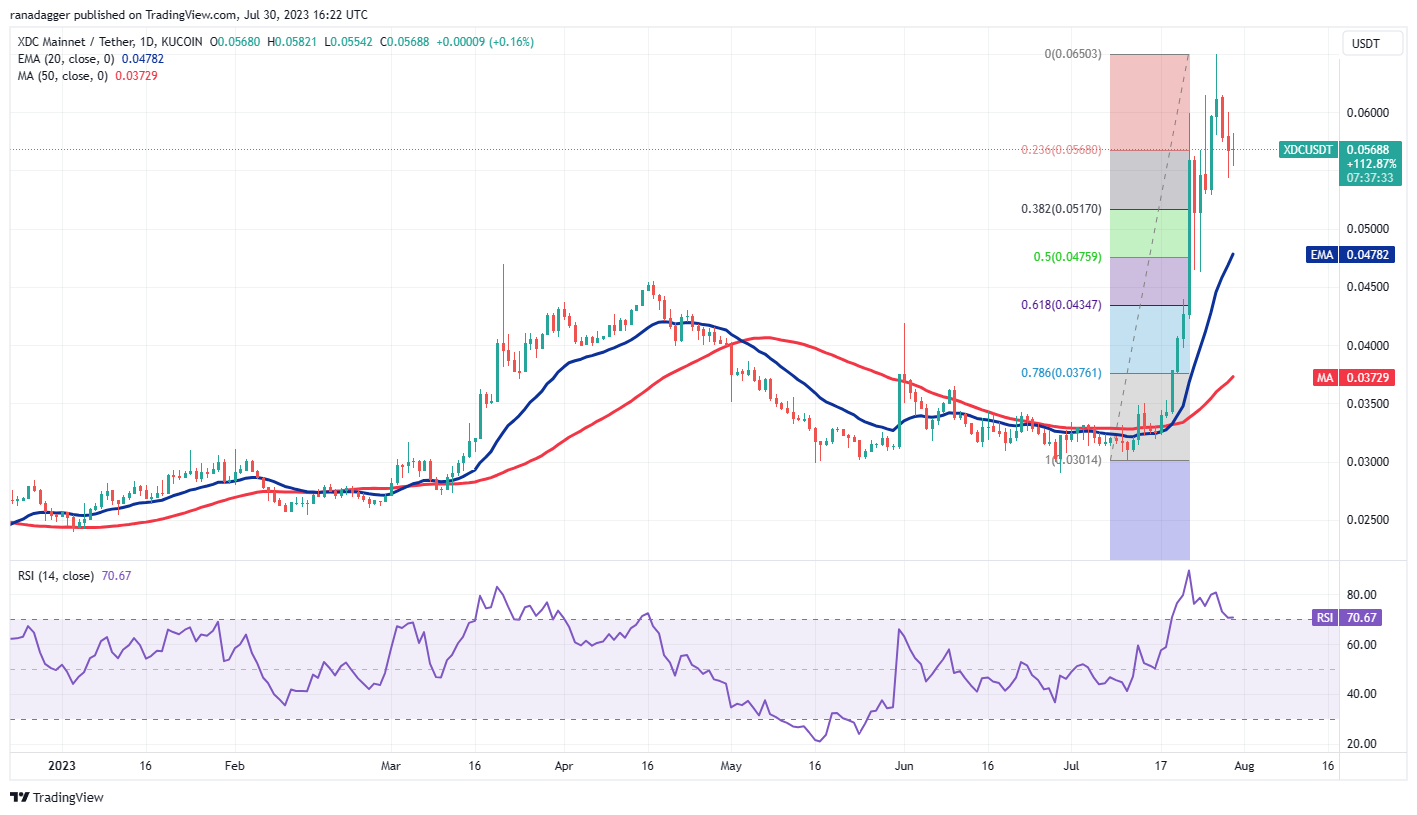
The price could first correct to the 38.2% Fibonacci retracement level of $0.05 and then to the 20-day EMA ($0.05). This is an important zone to watch out for because a strong bounce off it will suggest that the sentiment remains bullish.
If the price turns up from this zone, the bulls will attempt to resume the uptrend. A rally above the intraday high of July 27 could open the gates for an up-move to $0.10. This positive view will be negated on a break and close below the 20-day EMA.
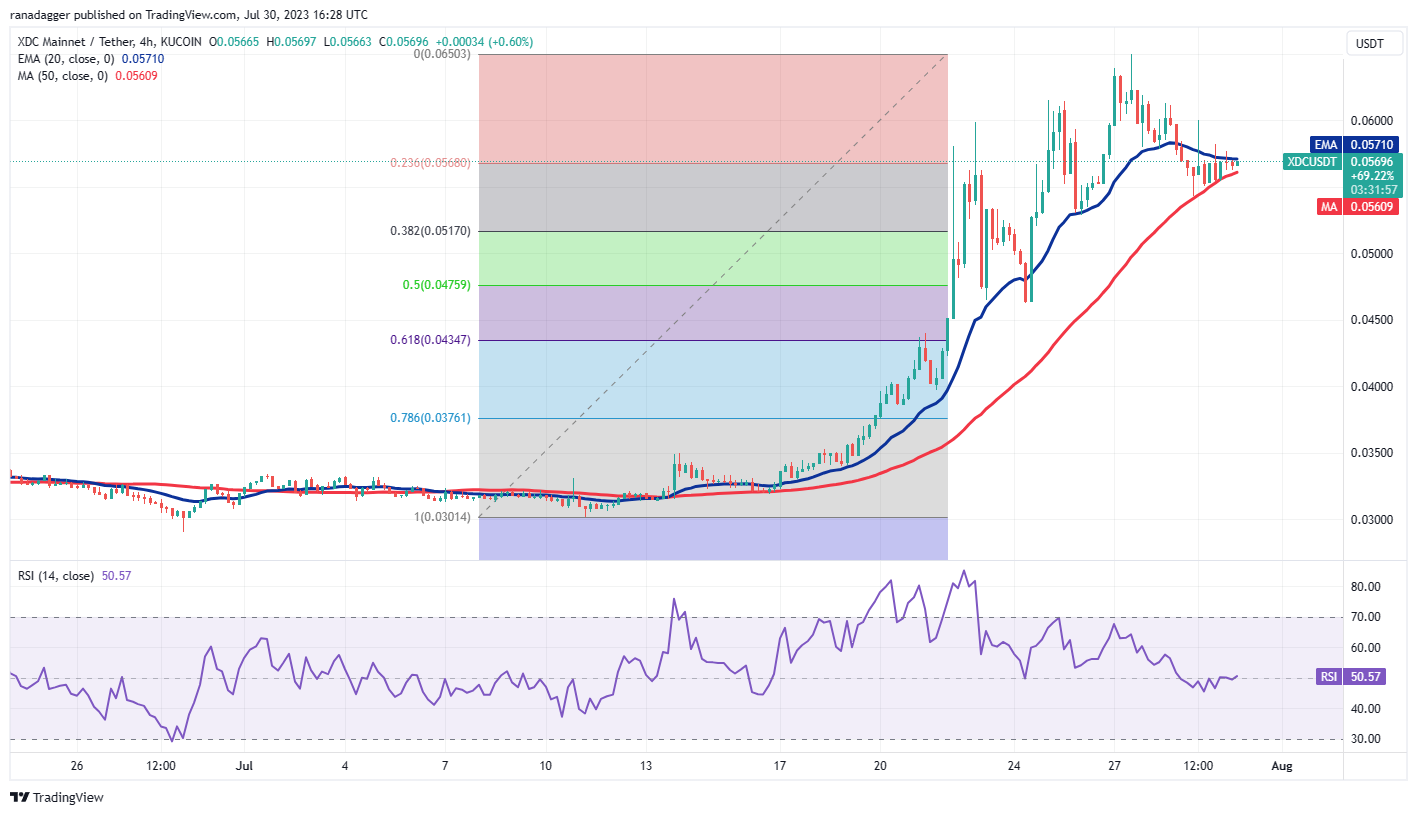
The bulls are attempting to arrest the pullback at the 50-SMA on the 4-hour chart. This is a positive sign but the flattening 20-EMA and the RSI near the midpoint suggest that the positive momentum may be weakening.
If the price turns down from the current level or the overhead resistance at $0.06 and breaks below the 50-SMA, it will signal the start of a deeper correction. The XDC/USDT pair may then slide to the 50% Fibonacci retracement level near $0.05.
This article does not contain investment advice or recommendations. Every investment and trading move involves risk, and readers should conduct their own research when making a decision.
