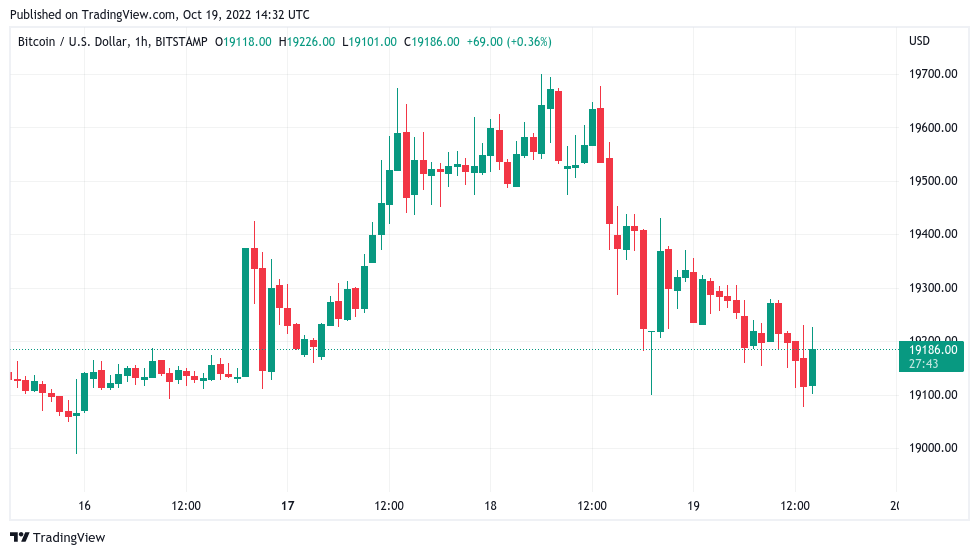
Bitcoin (BTC) sagged with United States equities at the Oct. 19 Wall Street open as markets awaited tech earnings.

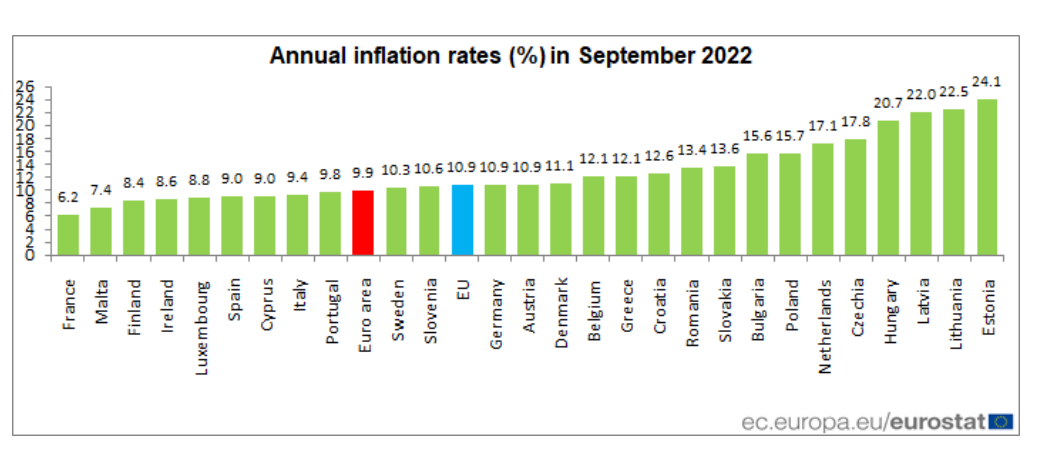
Eurozone sees fresh all-time high inflation
Data from Cointelegraph Markets Pro and TradingView showed BTC/USD circling $19,000 after falling steadily overnight.
Still trapped in a tight range, the pair offered few cues to traders seeking advantageous short-term plays, while some sources argued that overall, current levels represented solid buy levels.
“With little calendar events till the next FOMC in early November, crypto continuing to lag behind equities, and skews near flat, protective downside structures are the cheapest levels they have been since June,” trading firm QCP Capital concluded to Telegram channel subscribers on the day.
QCP Capital was referring to the upcoming meeting of the U.S. Federal Reserve’s Federal Open Market Committee, at which a decision on interest rate hikes would be made.
Those numbers would be apt to spark risk asset volatility, with the U.S. more influential in crypto markets than other nations when it comes to inflation.
The United Kingdom reported a new forty-year high in year-on-year inflation on the day, this reaching 10.1% as food prices took their toll. The eurozone told a similar story, with annual inflation hitting 10.9% in September — the highest ever recorded.
“The euro area annual inflation rate was 9.9% in September 2022, up from 9.1% in August. A year earlier, the rate was 3.4%,” a statement from Eurostat confirmed.
“European Union annual inflation was 10.9% in September 2022, up from 10.1% in August. A year earlier, the rate was 3.6%. These figures are published by Eurostat, the statistical office of the European Union.”

Analyst eyes dollar parabola break
Elsewhere, the Japanese yen was on track to hit the psychologically significant 150 per dollar level.
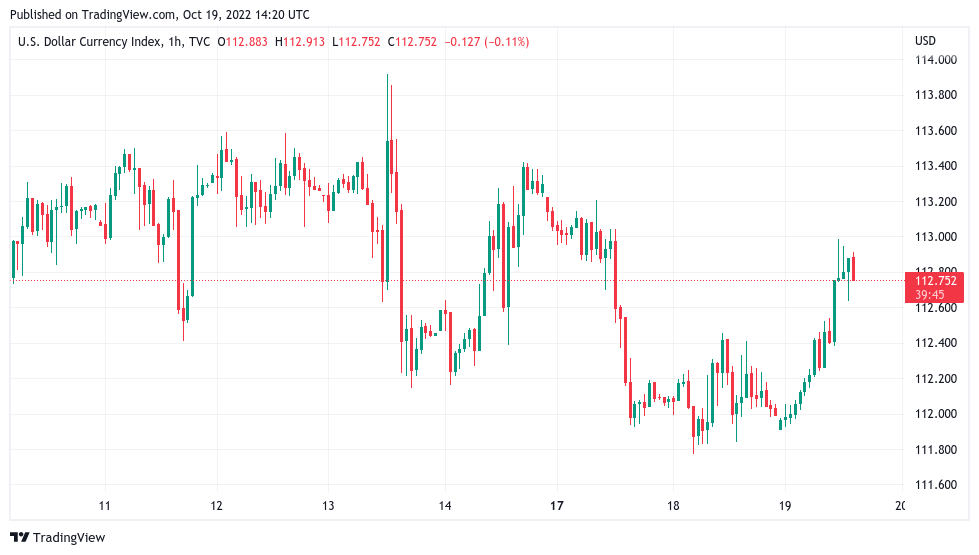
The U.S. dollar index (DXY) climbed on the day, seeking to crack 113 within an overall consolidation structure.
Related: Bitcoin mirrors 2020 pre-breakout, but analysts at odds whether this time is different

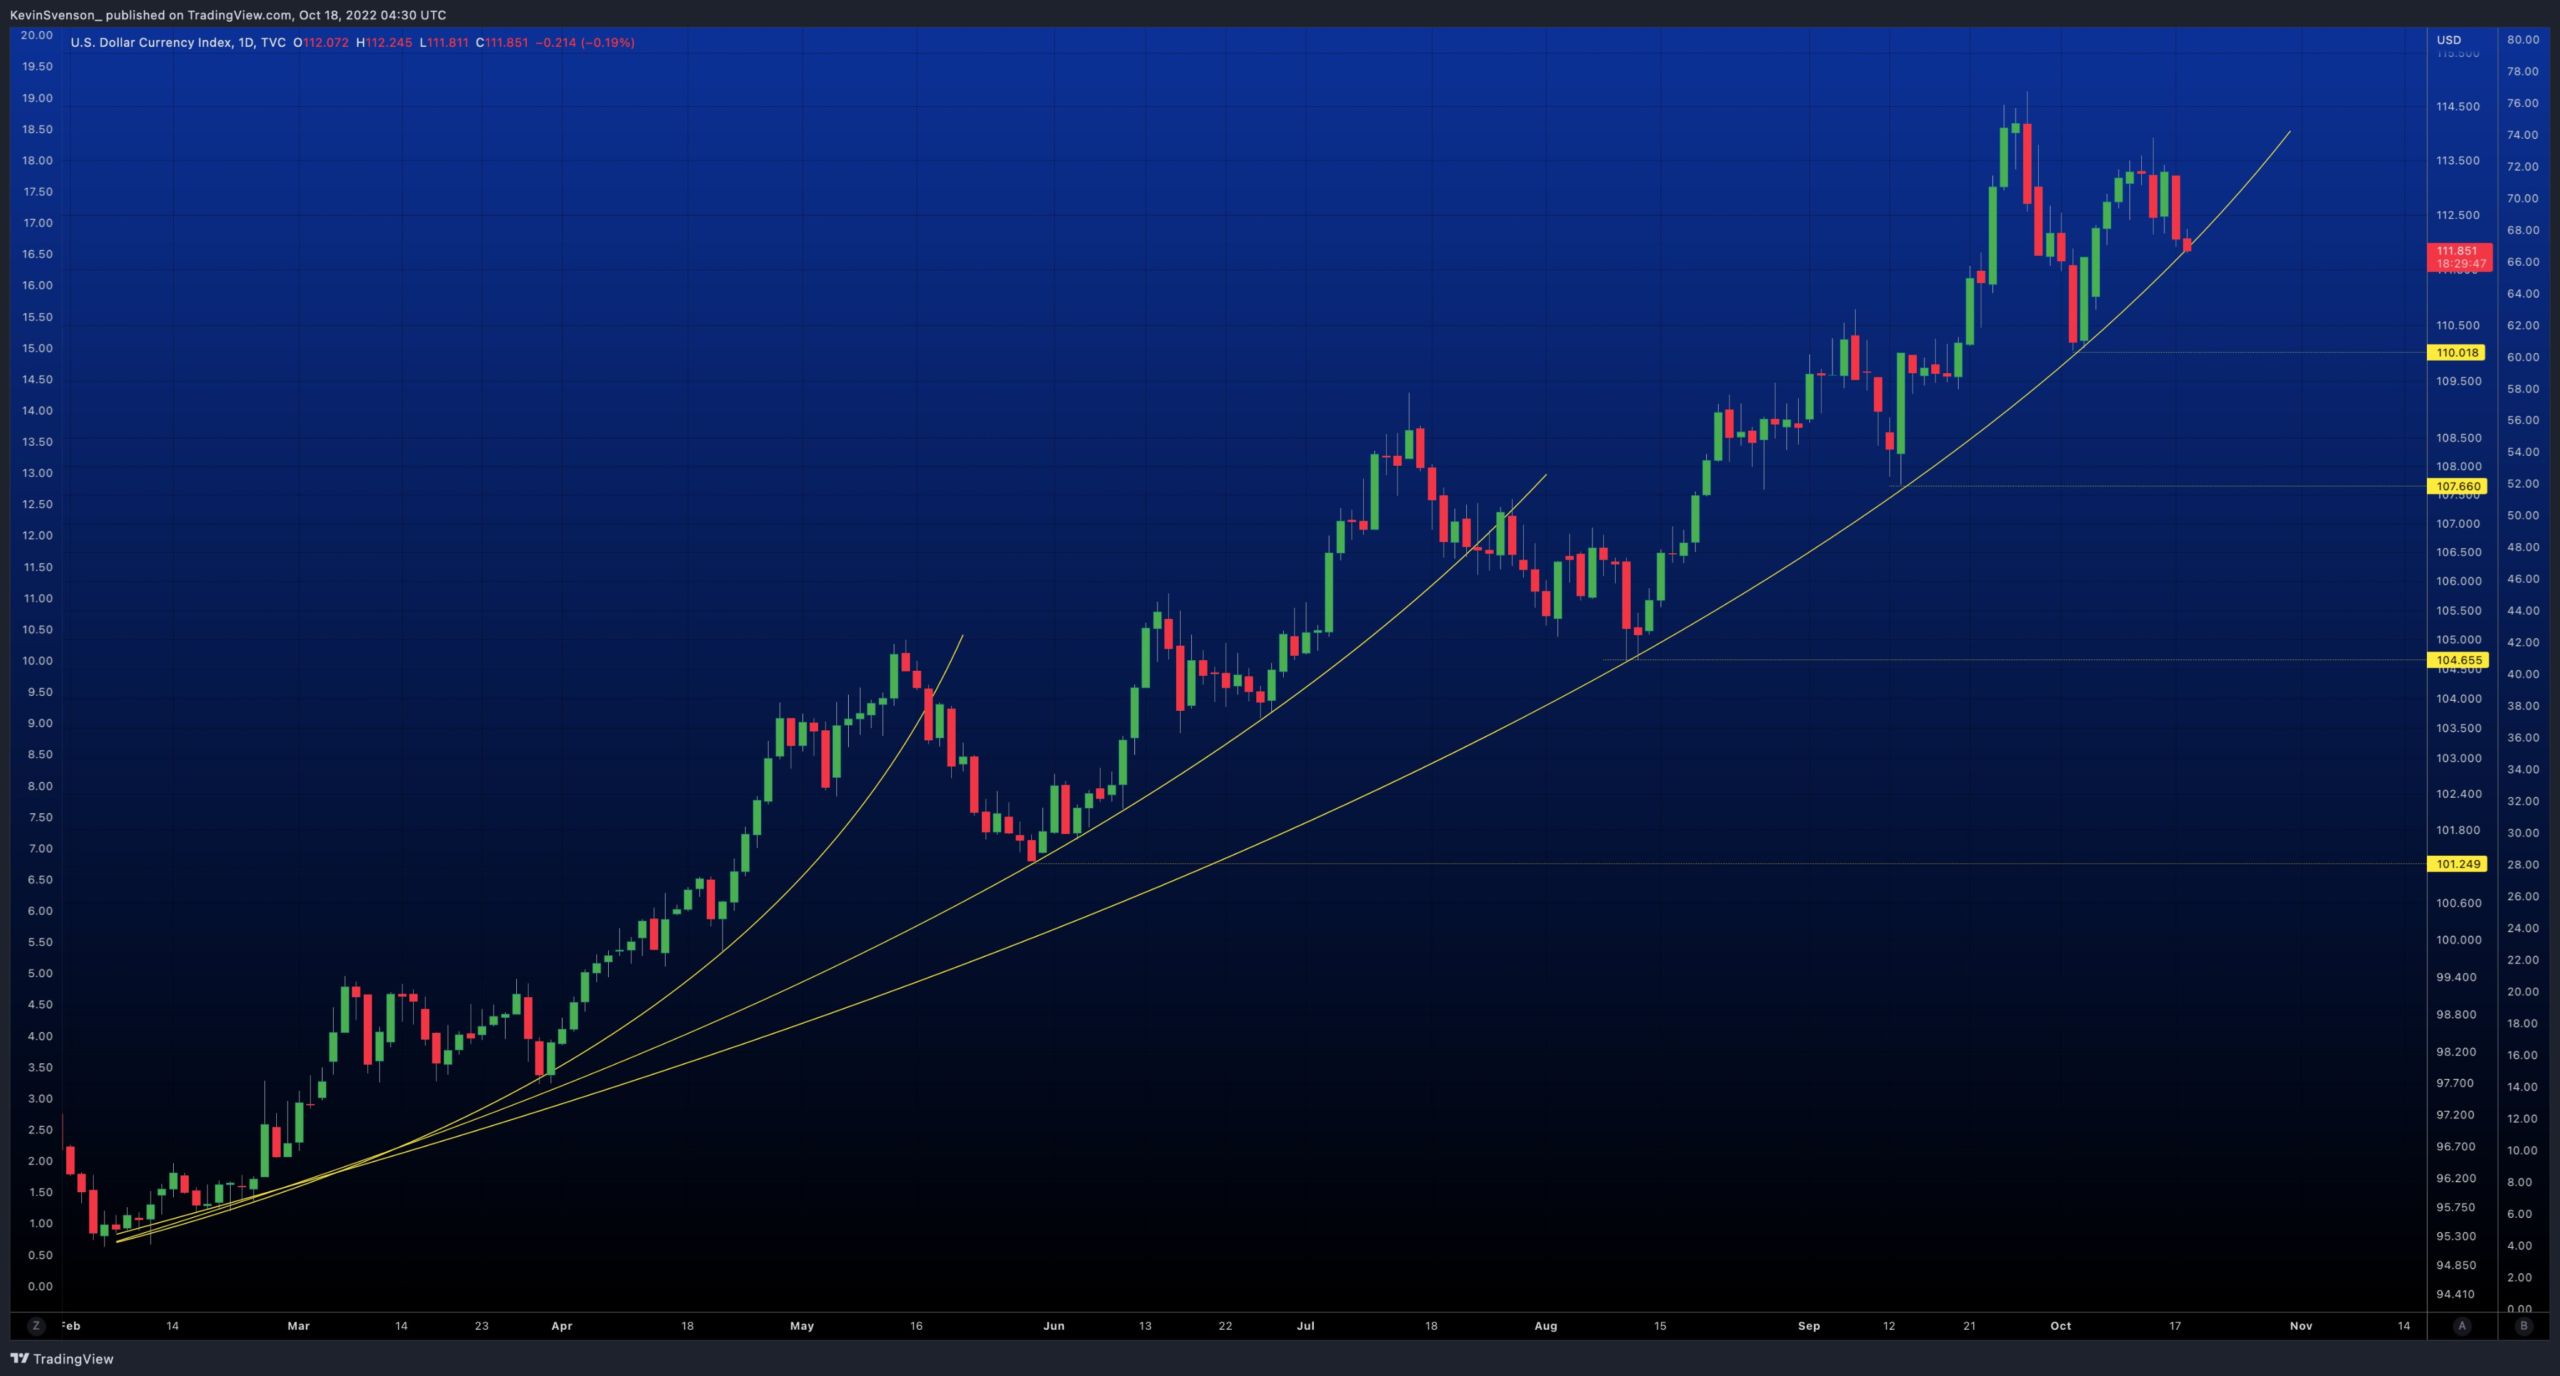
The day prior, market analyst Kevin Svenson had made a bold prediction for the dollar, arguing that Bitcoin would see explosive growth should the DXY 2022 “parabola” break down definitively.
“The $DXY is about to break below the parabola folks,” he summarized.
“If it does a huge BTC rally is likely to occur.”

The views and opinions expressed here are solely those of the author and do not necessarily reflect the views of Cointelegraph.com. Every investment and trading move involves risk, you should conduct your own research when making a decision.
