
Crypto price action has been rough over the past few months, but a few green shoots are finally beginning to emerge.
While Bitcoin (BTC) remains in a downtrend, its price has recently found support at the $17,000 level, and ping-pong price action in the $16,700–$17,300 range appears to be allowing traders to pursue some interesting setups in a few altcoins.
Let’s take a quick peek at some enticing patterns showing up on the weekly time frame.
Time for Litecoin’s halving hopium?
As a fork of Bitcoin, Litecoin (LTC) tends to turn bullish several months before its reward halving takes place, as was the case in 2015 and 2019.
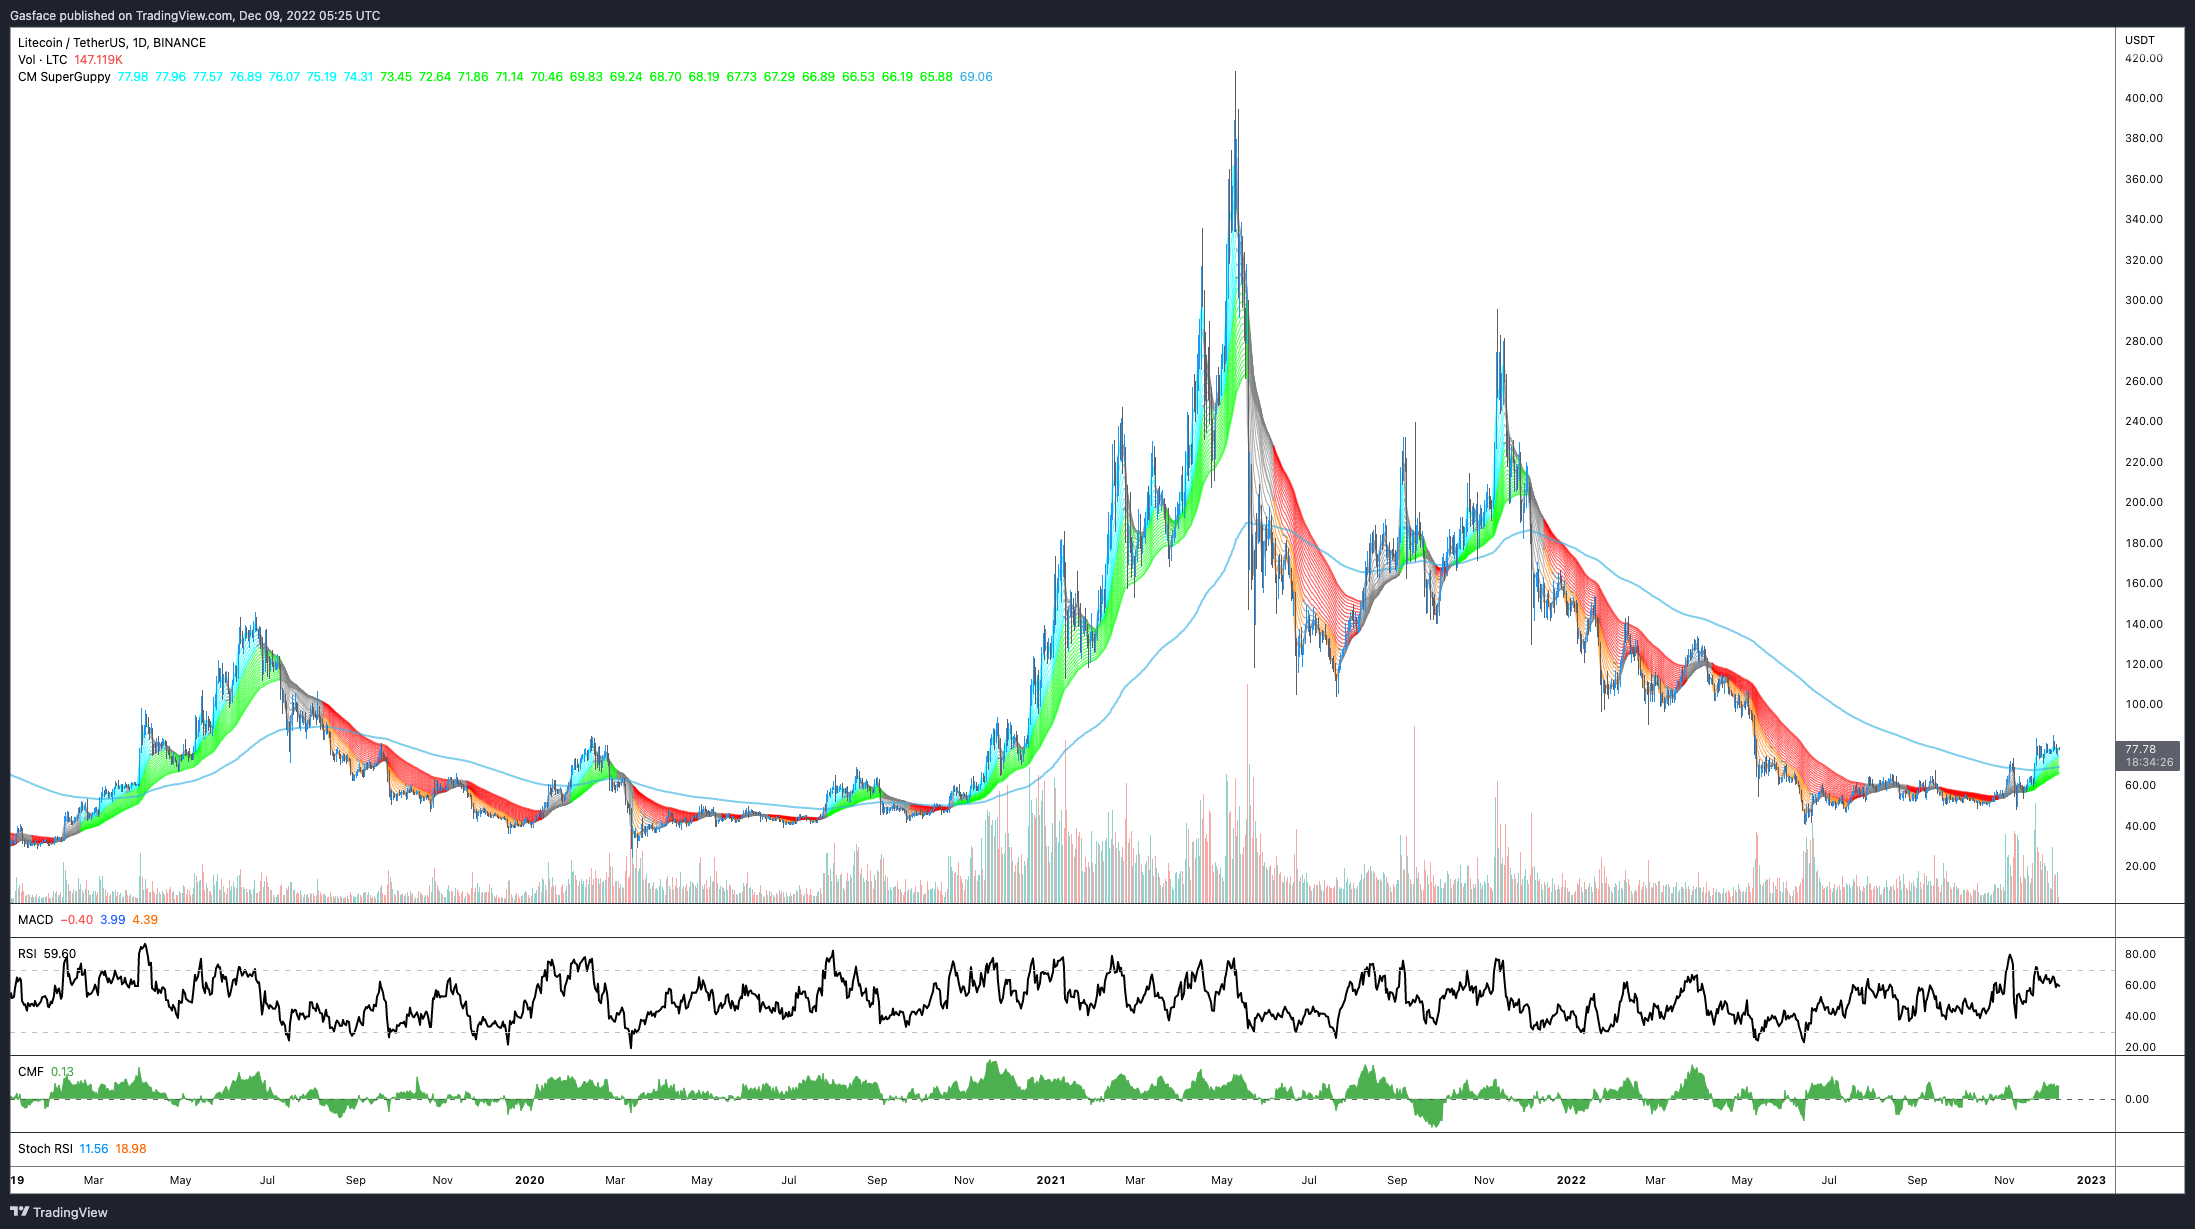
Litecoin’s next reward halving is 237 days away, and it appears that the altcoin is undergoing a little pre-halving hype. Since Nov. 6, LTC has gained 58.6%, and it is starting to mirror the triple price action that occurred in previous halvings.
The Guppy Multiple Moving Averages (GMMA) indicator on the daily time frame has also turned green — something that rarely happens.
From a technical analysis point of view, LTC maintains a trend of higher lows, consolidation and bull flag breakouts, which are then followed by further consolidation.
If LTC maintains its current market structure and continues to ride along the 20-day moving average, its price could see a pre-halving run up to the $100–$125 area.
Ether plots its own course
The ETH/BTC weekly timeframe shows some notable developments. Depending on how one sees it, there could be a nice inverse head and shoulders forming.
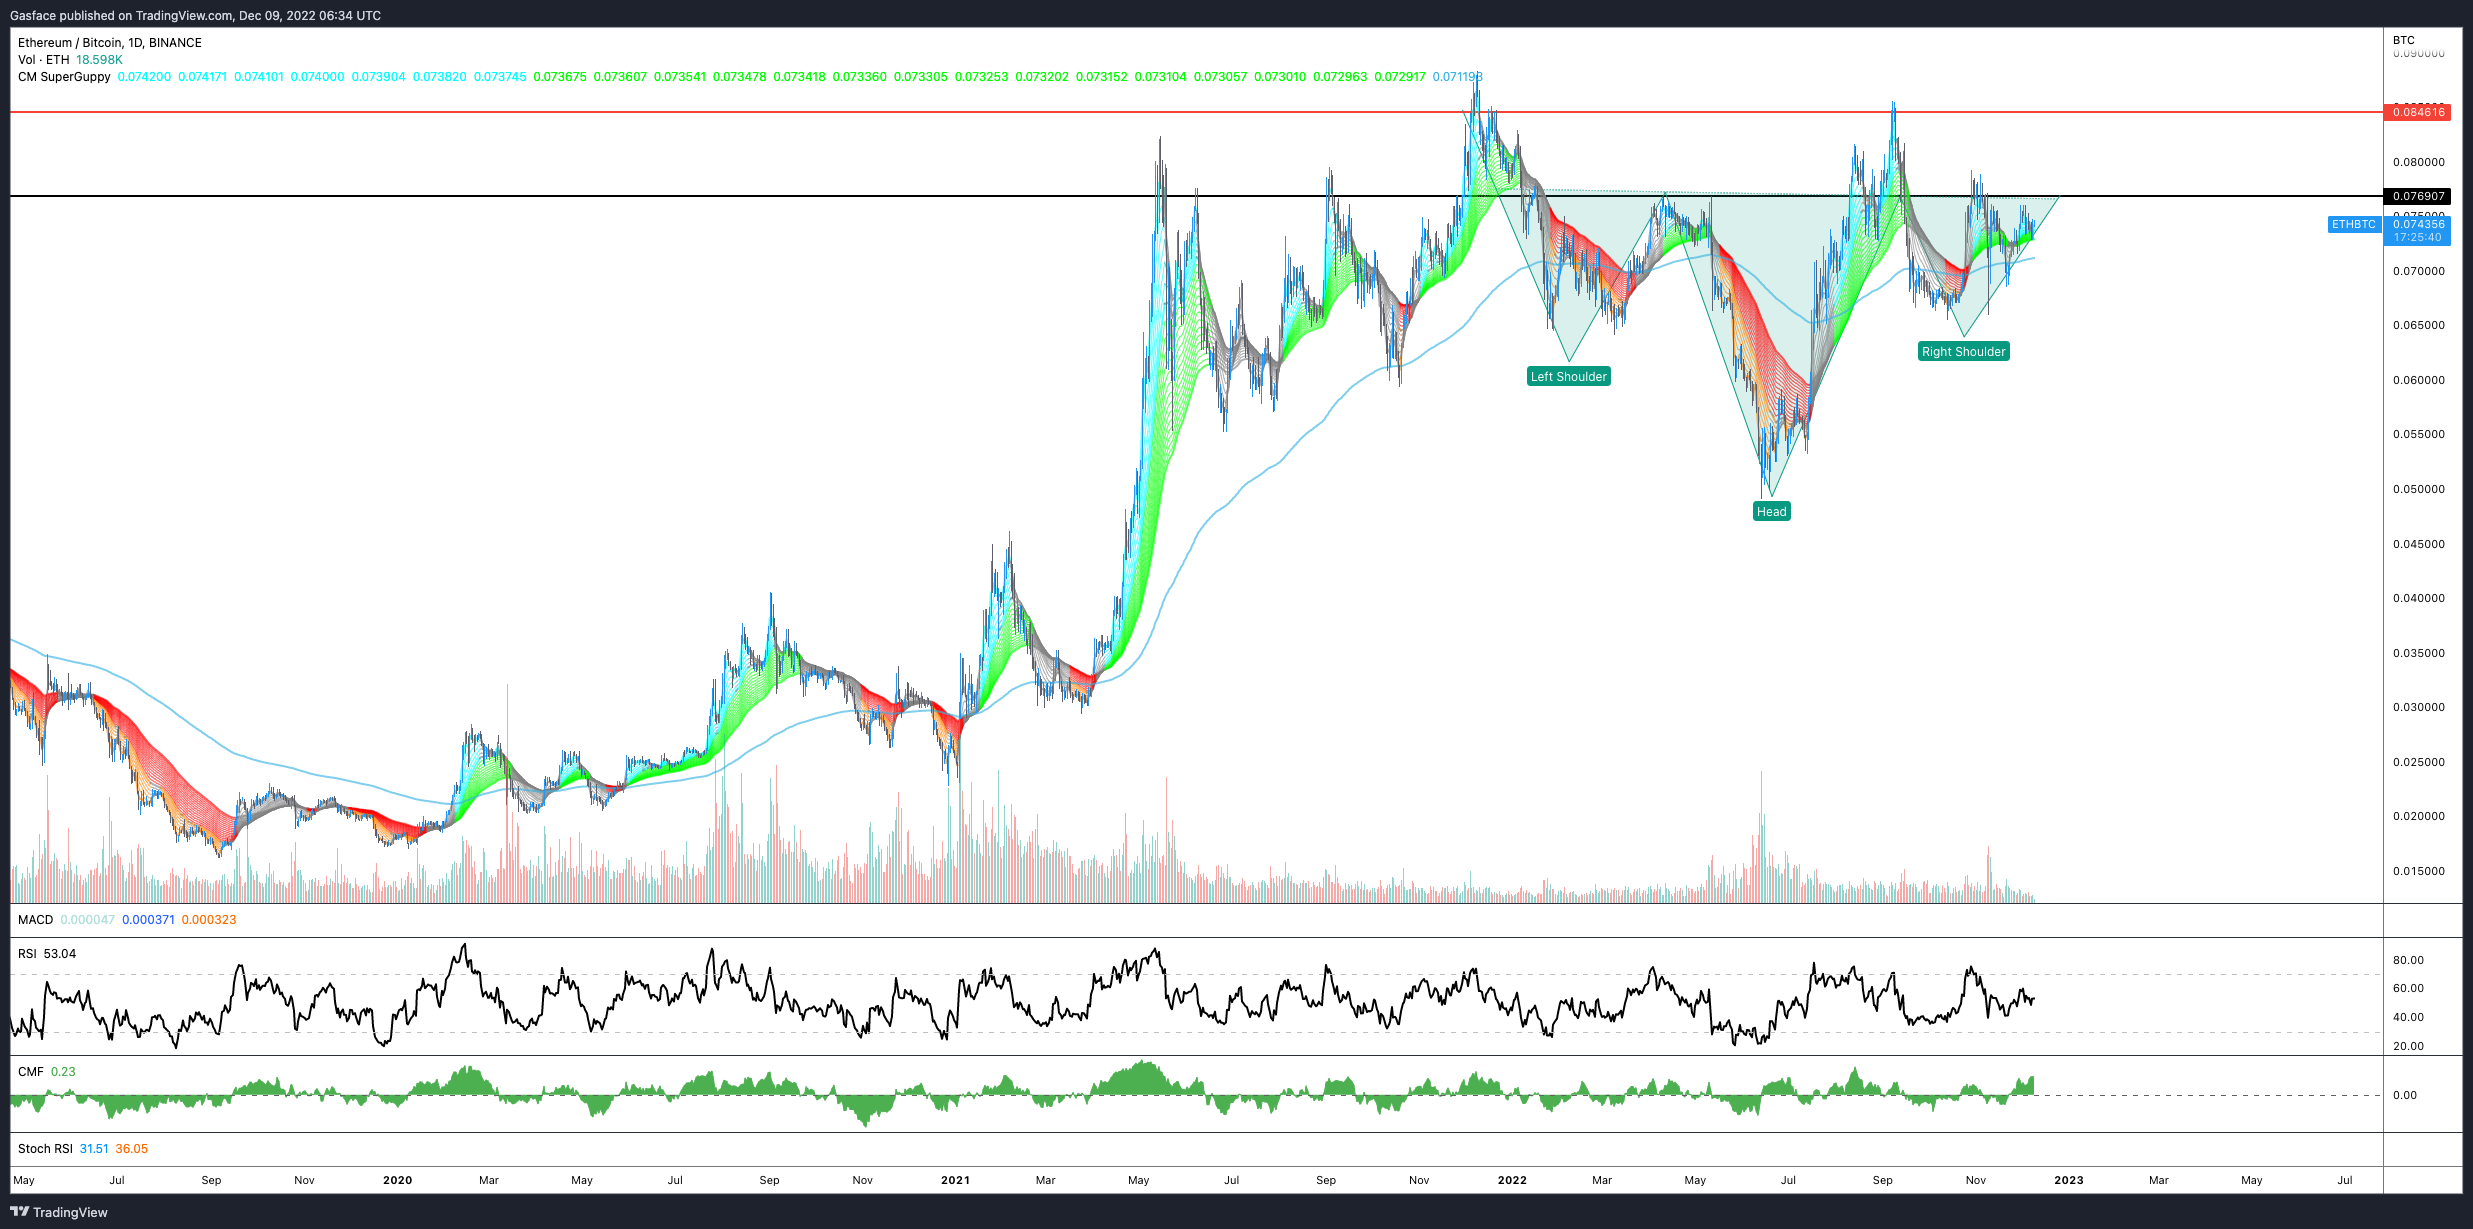
One could also argue that the ETH/BTC weekly is flashing a massive cup-and-handle pattern.
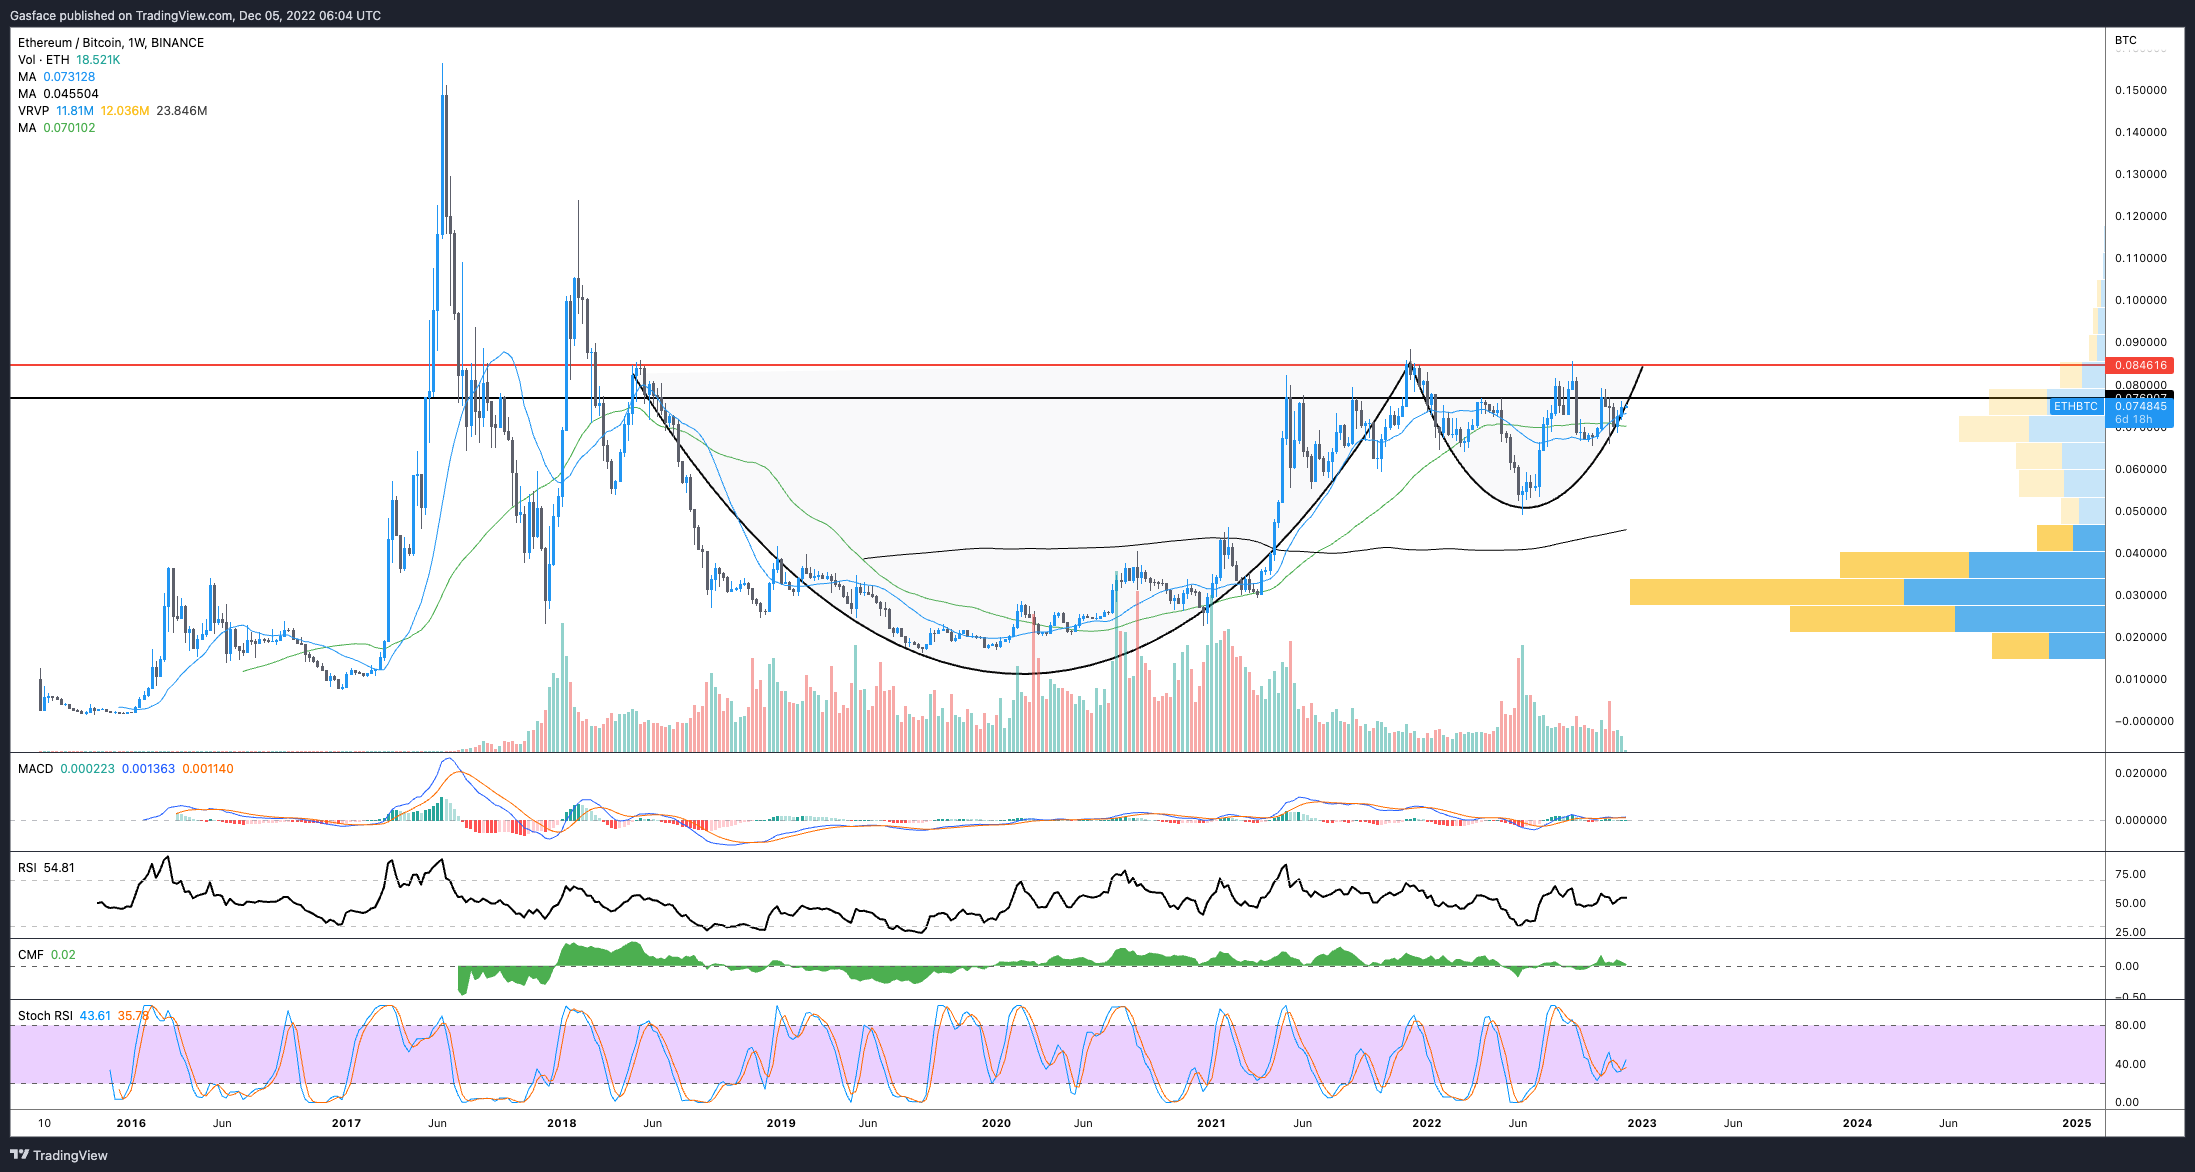
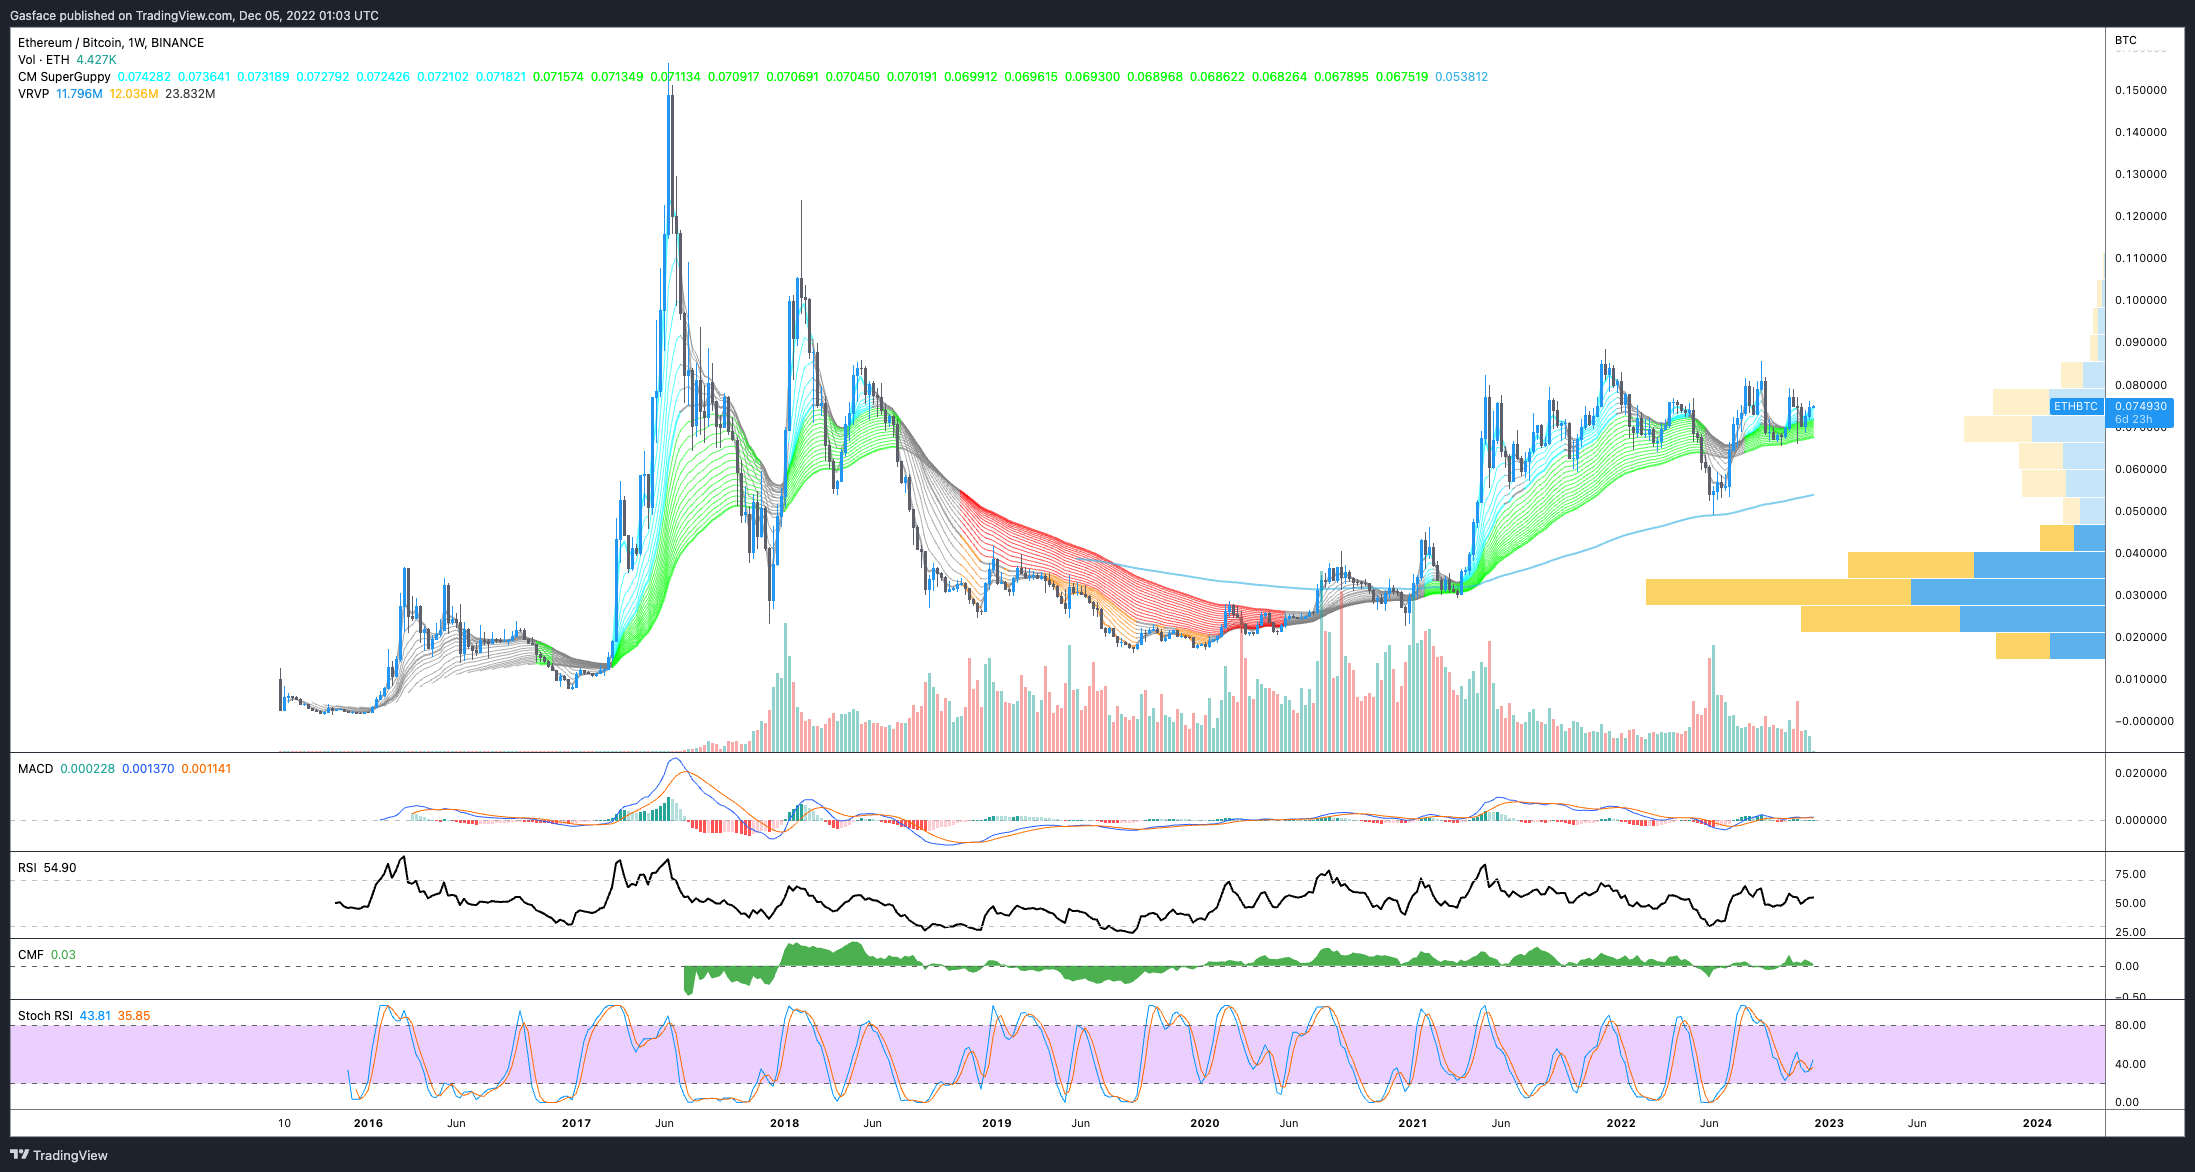
Like Litecoin, the GMMA indicator in the ETH/BTC weekly pair has been bright green since Aug. 8, which is nearly four months.
Ether’s price action in its U.S. dollar and BTC pair raise eyebrows, especially given the state of the broader market.
Despite this short-term bullish outlook, ETH’s price could be affected by red flags such as Ethereum blockchain censorship, U.S. Office of Foreign Assets Control compliance, ETH’s performance in its supposedly deflationary post-Merge environment, and concerns over the possibility of the U.S. Securities and Exchange Commission and Commodity Futures Trading Commission changing their perspective on Ether being a commodity.
On-chain data tells an interesting tale
Looking at on-chain data provides a bit of color. Data from Glassnode shows that since Nov. 7, Ethereum addresses with balances greater than 32 ETH, 1,000 ETH and 10,000 ETH have been on an uptrend.
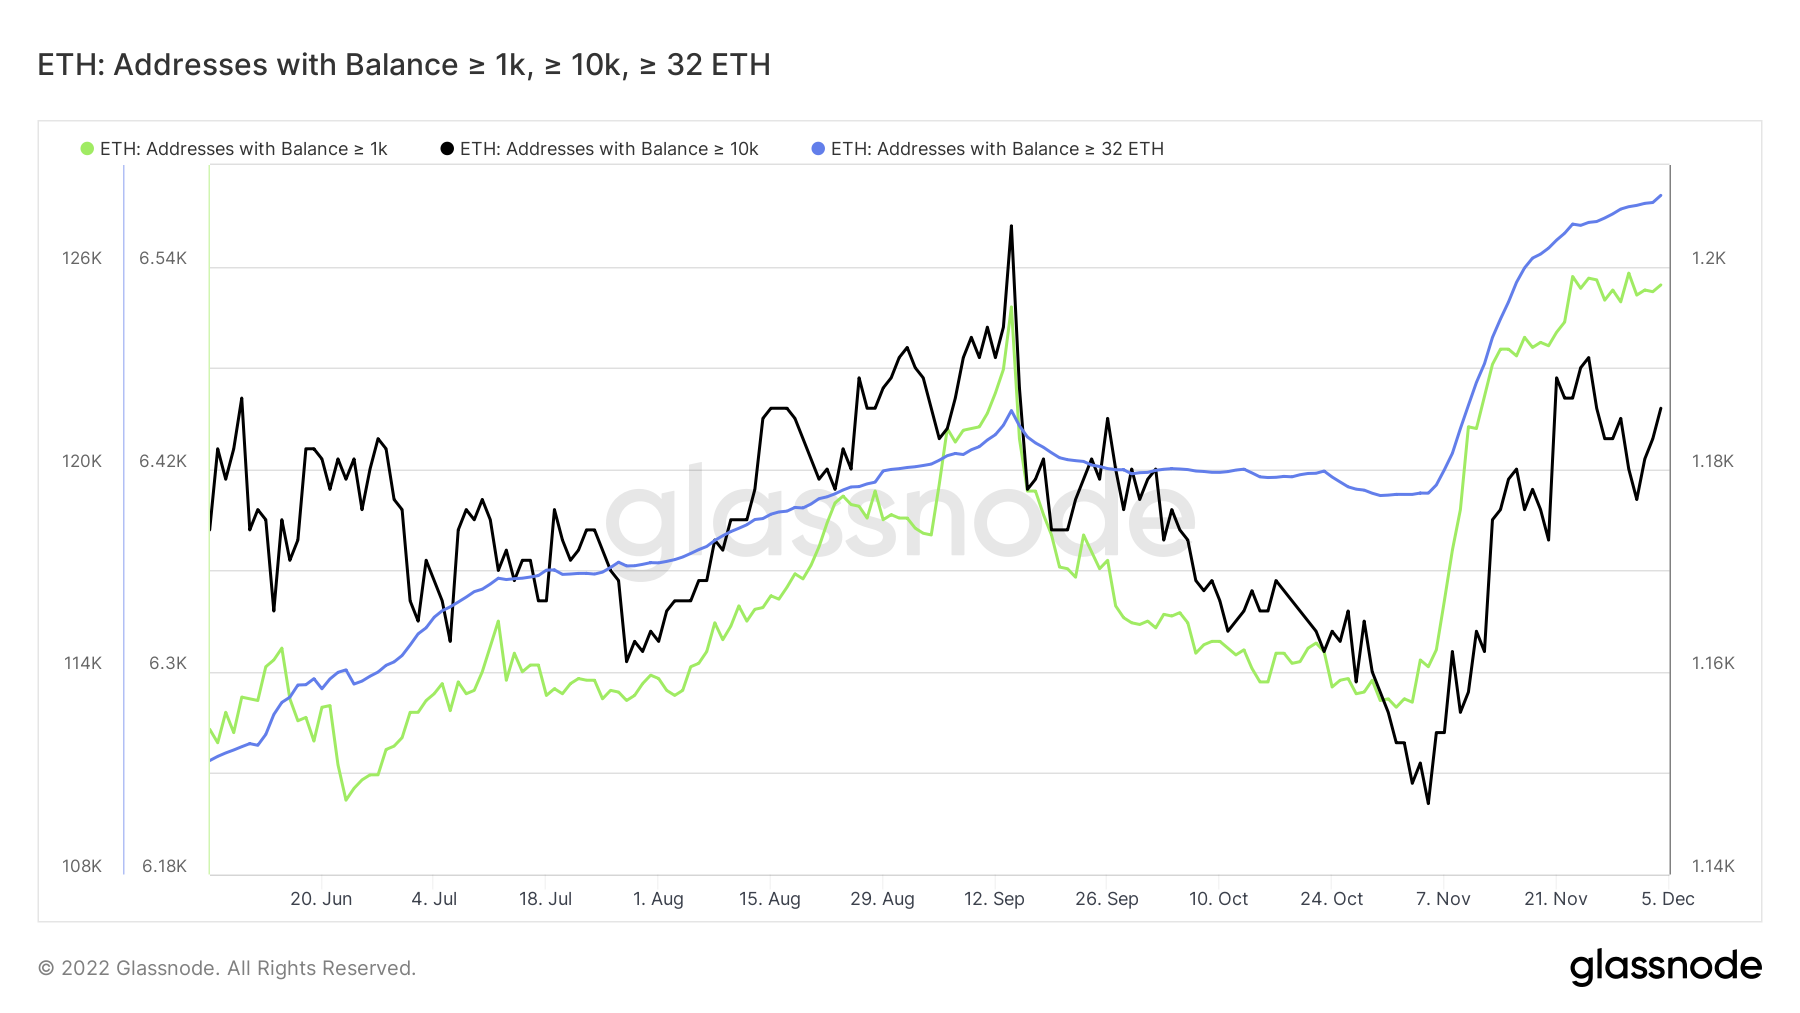
While the rebound is small, it’s important to keep an eye on growth metrics like new Ethereum addresses, daily active users, increases in a variety of balance cohorts and the percentage of holders in profit because they could eventually mark a change in trend and sentiment.
Contrasting these metrics against trading volumes, price and other technical analysis indicators can help investors attain a more comprehensive view of whether opening a position in ETH is a good idea.
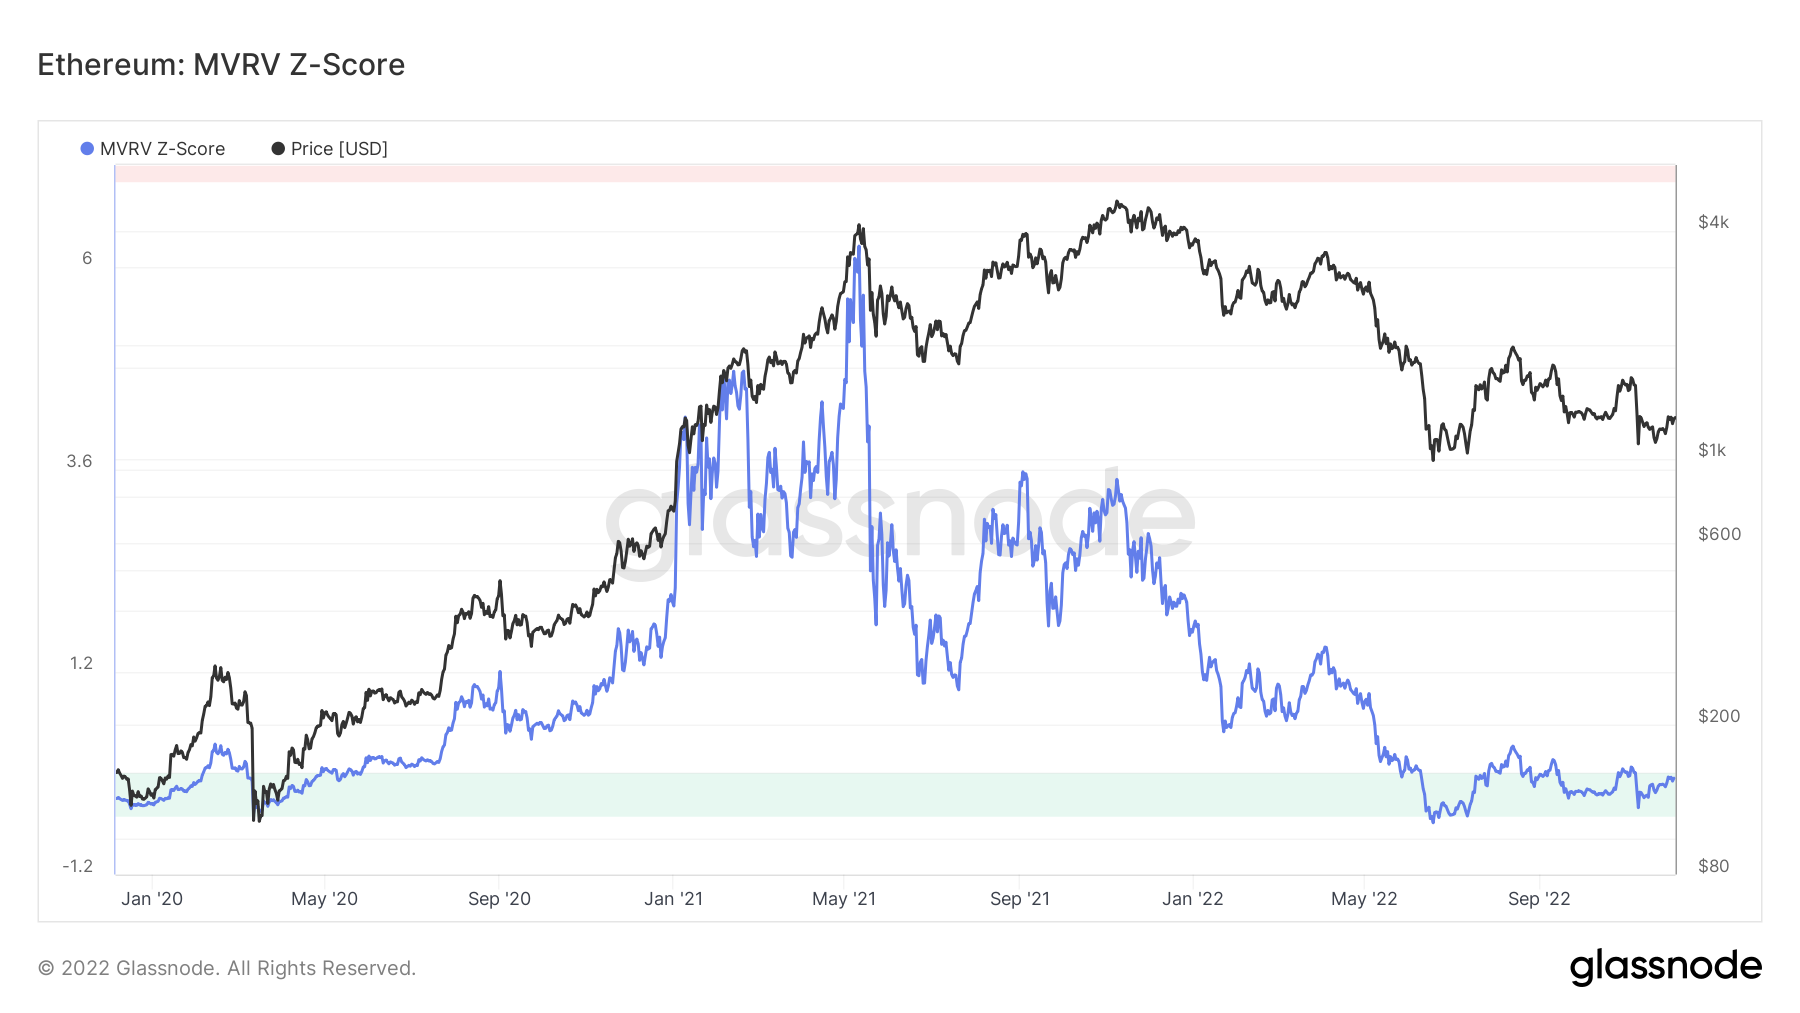
ETH’s MVRV Z-Score is also flashing a few signals. Similar to Bitcoin on-chain analysis, the MVRV Z-Score examines the current market capitalization of the asset versus the price at which investors purchased it.
The metric can suggest when an asset is overvalued or undervalued relative to its fair value, and it tends to signal market tops when the market cap is significantly higher than the realized cap.
According to the three-year MVRV Z-Score chart below, the Z-Score is back in the green zone.
Related: Approach with caution: US banking regulator’s crypto warning
Considering the uncertainty in the market, worries related to stringent crypto regulation, and the unresolved threats of insolvency, bankruptcy and contagion from the FTX debacle, it’s difficult to determine whether it’s time to go long on ETH.
Risk-averse traders looking to pull the trigger might consider going spot long and short through futures. That way, if one is long-term bullish on ETH, they can build a position while also hedging against short-term downside.
This newsletter was written by Big Smokey, the author of The Humble Pontificator Substack and resident newsletter author at Cointelegraph. Each Friday, Big Smokey writes market insights, trending how-tos, analyses and early-bird research on potential emerging trends within the crypto market.
The views, thoughts and opinions expressed here are the authors’ alone and do not necessarily reflect or represent the views and opinions of Cointelegraph.
This article does not contain investment advice or recommendations. Every investment and trading move involves risk, and readers should conduct their own research when making a decision.
